Download
1 / 18
180 likes | 205 Views
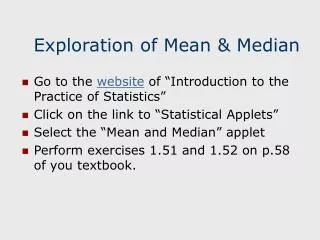
Learn how to calculate averages, construct boxplots, identify outliers, and interpret data variations in this comprehensive guide. Discover key concepts such as standard deviation, variance, and comparative analysis of data sets.

E N D
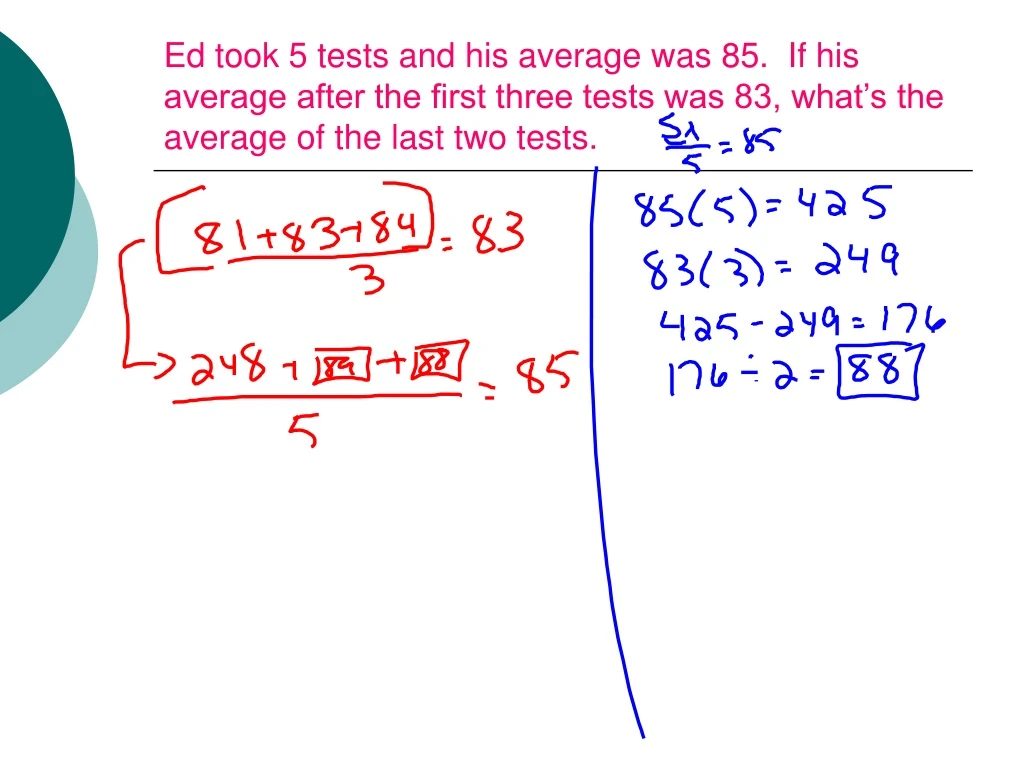
Ed took 5 tests and his average was 85. If his average after the first three tests was 83, what’s the average of the last two tests.
On Thursday, 20 out of 25 students took a test and their average was 80. On Friday, the other 5 students took it and their average was 90. What was the class average?
Examples • Average salaries of professional football players. • Scores on a test when there’s one that hasn’t been made up yet. • Average salaries of 1st year teachers
Boxplots • Provides information about the center, spread, and symmetry (skewness) of the data. • Multiple boxplots can be used to compare data.
Constructing a boxplot. • Find the five number salary • Minimum • Q1 • Median • Q3 • Maximum • Plot on number line. • Box in the IQR and draw whiskers to the min & max.
8, 10, 22, 24, 25, 25, 26, 27, 45, 72 • Graph & Describe
Outlier • A value is considered an outlier if it is more than 1.5 IQR away from the closest end of the box.
5, 7, 9, 9, 10, 11, 13, 17, 29 • Find if there are any outliers.
Using the Calculator. • Put data in List • Press 2nd stat • Turn plot 1 on and choose boxplot • Zoom 9
Comparative • Measure your longest finger. • Create boxplot of girls vs boys. • Describe
Standard Deviation • This is a measure of the average distance of the observations from their mean. • Variance – it is the average of the squared distance from the mean.
Homework • Page 71 (89, 91, 93, 95, 97, 105, 107-110) • Bring Candy for tomorrow!