Download
1 / 18
240 likes | 512 Views
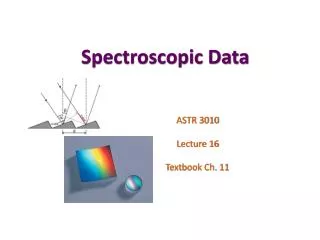
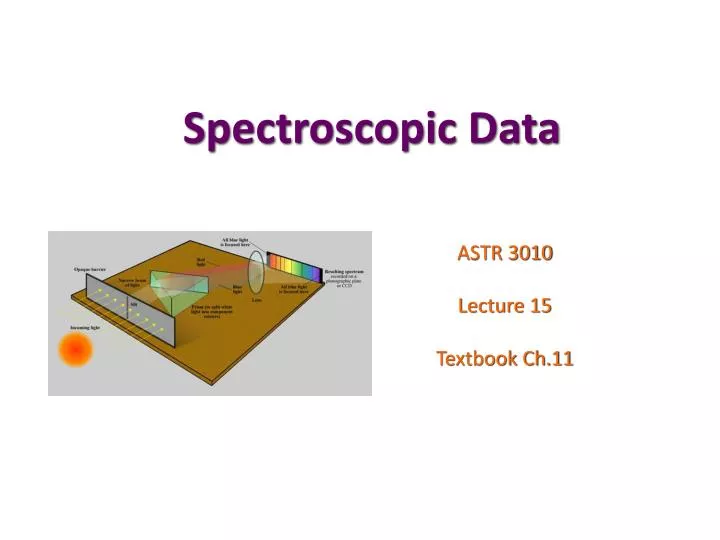
Spectroscopic Data. ASTR 3010 Lecture 15 Textbook Ch.11. Spectroscopic Measurement. CCD or other digital Detector. Schematic Diagram of a Typical Spectroscopic Data. Only Readout the relevant portion of CCD array. Spectroscopic data are typically long and slender.

E N D
Spectroscopic Data ASTR 3010 Lecture 15 Textbook Ch.11
Spectroscopic Measurement CCD or other digital Detector
Only Readout the relevant portion of CCD array • Spectroscopic data are typically long and slender. to save the readout time and storage space…
Actual Spectroscopic Data • Similar to Imaging Data, a similar set of calibration images is obtained for spectroscopic observation same pre-processing!! • over-scan correction • trimming • bad-pixel correction • cosmic ray hits removal • zero correction • dark correction • flat-fielding
Unique spectroscopic calibration data • Unlike imaging observations, two additional kinds of calibration data are obtained for spectroscopic observations. • arc images (wavelength correction) • smooth spectrum standards (telluric feature correction) • (and possibly flux standard stars = standard stars in imaging)
Steps of spectroscopic data reduction bad pixel, bias, over-scan, trim, zero, flat-fielding find trace extract normalize using arc images (e.g., gas emission lines) using stars with known smooth spectra line width measurement, Teff, [Z/H], vsini, etc.
Extraction of Spectra words in green denote corresponding IRAF commands for the task finding the aperture and defining the sky regions apfind& apedit
spectral aperture is not always a horizontal line! need to trace the aperture along the dispersion axis aptrace
Wavelength calibration using Arc images • Excited lines from a combination of noble gases (He, Ne, Ar, Xe, Th, etc.) using arc images, you can convert pixel numbers to wavelength! identify
How do we extract (find and trace) arc spectra? • or very faint objects? • Use well exposed bright star spectrum as a reference!
Normalization or Flux Calibration continuum sensfunc and calibrate continuum or splot
Telluric Correction Telluric standard stars : stars with no (or very little) spectral line feature. low metallicity stars, white dwarfs, fast rotating stars telluric
Plotting the extracted spectra and … splot display the extracted spectrum and do simple operations on the spectrum such as continuum normalization and equivalent width measurements. ‘h’ + ‘k’ EW fit with A Gaussian to continuum=1
Equivalent Width • Quantitative indicator of the strength of a spectral feature • EW = area of the spectral feature area = area 1.0 0.0 EW unit is the wavelength unit of the spectrum
One caveat in spectroscopic pre-processing… Flat images… flat images sometime taken w/wo the dispersing element. Which one is better? Is only one kind useful?
Flats in spectroscopic data this spectrum is a combination of the above detector flat + spectral response of the system. Flat-fielding is to remove the pixel-to-pixel sensitivity variation! Other gradual, global variation can be taken out later.
In summary… Important Concepts Important Terms aperture tracing telluric correction equivalent width • Structure of the spectroscopic data • Steps of spectroscopic reduction • good manual http://iraf.noao.edu/iraf/ftp/iraf/docs/spect.ps.Z • Chapter/sections covered in this lecture : 11.6