Download
1 / 14

E N D
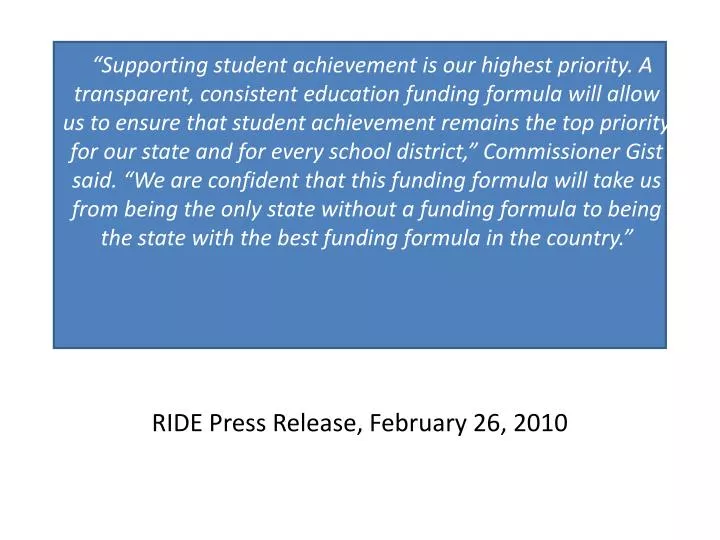
“Supporting student achievement is our highest priority. A transparent, consistent education funding formula will allow us to ensure that student achievement remains the top priority for our state and for every school district,” Commissioner Gist said. “We are confident that this funding formula will take us from being the only state without a funding formula to being the state with the best funding formula in the country.” RIDE Press Release, February 26, 2010
The Best Funding Formula in the Country: What’s Not To Love? Samuel D. Zurier, Esq.
Impact on Pawtucket Expenditure Per Student* 2009-10 Actual 2010-11 Actual 2011-12 RIDE Formula 2016-20 RIDE Formula 2007 Funding Formula 2009-10 State Avg. State Funds $7,510 $7,207 $7,452 $8,672 $12,641 Local Funds** $3,238 $3,292 $3,323 $3,692 $2,449 Total State + Local $10,748 $10,499 $10,785 $12,364 $15,090 $13,600 (Excludes Federal funds) *Assuming average daily attendance of 2009 **Approximation, assuming 2% annual increases.
Impact on Woonsocket Expenditure Per Student 2009-10 Actual 2010-11 State Budget 2011-12 RIDE Formula 2016-20 RIDE Formula 2007 Funding Formula 2009-10 State Avg. State Funds $7,781 $7,401 $7,558 $8,524 $13,509 Local Funds** $2,284 $2,330 $2,376 $2,614 $1,722 Total State + Local $10,065 $9,815 $9,934 $11,138 $15,231 $13,600 (Excludes Federal funds) *Assuming average daily attendance of 2009 **Approximation, assuming 2% annual increases.
State’s Contribution to Overall Cost Federal State Local USA Average 11.3% 47.5% 44.1% Massachusetts 7.6% 41.0% 47.2% Rhode Island 12.4% 28.8% 60.6% 2007 Funding Formula 12.4%* 38.5%* 49.1%* *This is the 3rd lowest State share in the country Source: National Education Association: Rankings and Estimates, 2011-12 *The 2007 Formula called for a 44% State/56% local split
Foundation Amount RIDE Formula Core Instructional Amount: $8,333 per student 2007 General Assembly Formula Core Foundation Amount: $10,600 per student
English Language Learners Number of States funding ELL Programs at State Level: 37 Rhode Island’s rank for Latino children in Math on NAEP Tests: 50th out of 50 Cost to Fund: $12 Million Providence Journal Op-Ed, June 2, 2010
FOLLOW THE MONEY: Communities that are the biggest winners under the RIDE Formula Community EWAV Aid (indicated state share) Formula Aid Children in Poverty Formula Aid per Child in Poverty JAMESTOWN $0 (-112%) $205,291 40 $5,132 LITTLE COMPTON $0 (159.2%) $126,870 29 $4,375 NARRAGANSETT $0 (-107.7%) $1,607,955 200 $8.040 NEW SHOREHAM $0 (-835.4%) $113,977 17 $6,704 NEWPORT $0 (-39.9%) $9,186,000 1,185 $7,752 TOTAL $0 $11,240,092 $1,471 $7,641
Who Pays? Community Woonsocket Pawtucket State Aid under “Quadratic Mean” $50.2 $71.9 State Aid under Simple EWAV $53.6 $73.4 Difference ($3.4) ($1.5) All figures in millions of dollars.
2010 Update* Source: Rhode Island’s Future
How to Improve the “Best Funding Formula in the Country”