Download
1 / 12
120 likes | 138 Views
Learn to solve and graph linear inequalities in 2 variables to tackle real-world problems effectively. Understand the forms of these inequalities and master graphing techniques.

E N D
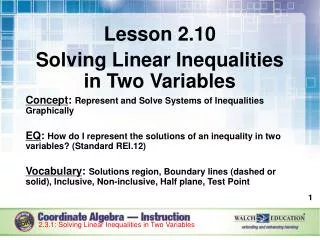
OBJECTIVES: • Solve and Graph a linear inequality in 2 variables. • Use a linear inequality in 2 variables to solve real-world problems.
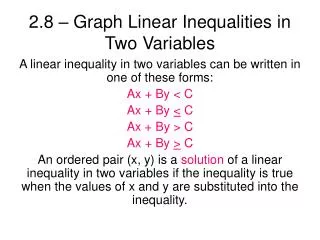
Definition:Linear Inequality in 2 Variables • Using variables x & y, it is any inequality that can be written in one of the forms below, where A ≠ 0 and B ≠ 0. • Ax + By ≥ C • Ax + By > C • Ax + By ≤ C • Ax + By < C
SOLUTION… • Ordered Pair (x, y) • A region of the coordinate plane & is called a half-plane bounded by a boundary line.
Graph: y < x + 2 • Graph the line. • Use a dashed line because the values on this line are not included in the solution • Choose a point such as (0, 0) to test. • Since (0, 0) satisfies the inequality, shade the region that contains the point
Graph: y ≥ -2x + 3 • Graph the boundary line. • Use a solid line because the values on this line are included in the solution • Choose a point like (0, 0) to test • Since (0, 0) does not satisfy the inequality, shade the region that does not contain this point.
Extra Examples, If Needed… • y > -2x – 2 • y ≤ 2x + 5
GRAPH: -2x – 3y ≤ 3 • Sometimes, you may need to solve for for y before graphing.
SOLUTION to 1 variable equations • A half-plane • Graph: x > -2
Example • Graph: y ≤ -1
ACTIVITY PG. 175