Download
1 / 20
200 likes | 309 Views
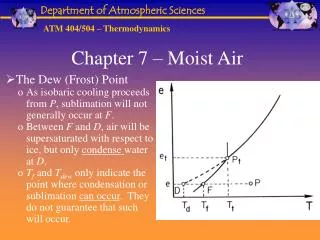
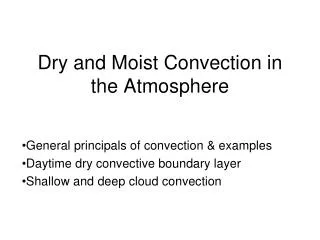
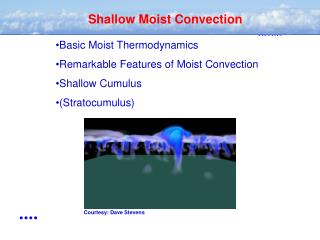
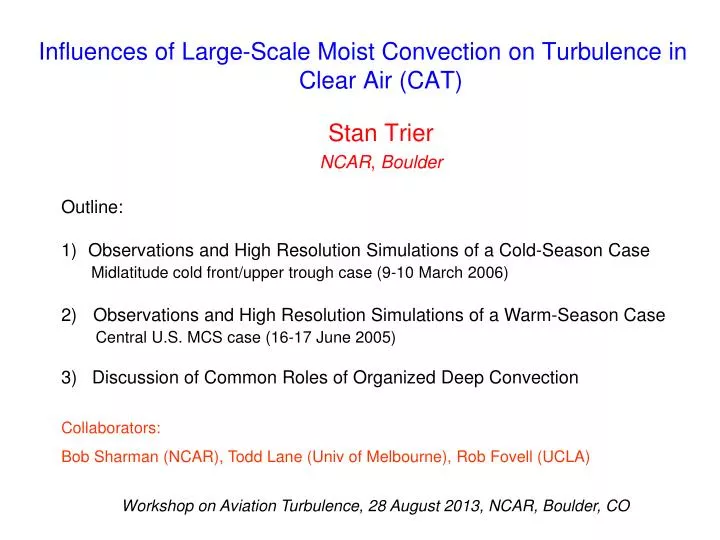
Influences of Large-Scale Moist Convection on Turbulence in Clear Air (CAT). Outline: Observations and High Resolution Simulations of a Cold-Season Case Midlatitude cold front/upper trough case (9-10 March 2006) Observations and High Resolution Simulations of a Warm-Season Case

E N D
Influences of Large-Scale Moist Convection on Turbulence inClear Air (CAT) • Outline: • Observations and High Resolution Simulations of a Cold-Season Case • Midlatitude cold front/upper trough case (9-10 March 2006) • Observations and High Resolution Simulations of a Warm-Season Case • Central U.S. MCS case (16-17 June 2005) • 3) Discussion of Common Roles of Organized Deep Convection Stan Trier NCAR, Boulder Collaborators: Bob Sharman (NCAR), Todd Lane (Univ of Melbourne), Rob Fovell (UCLA) Workshop on Aviation Turbulence, 28 August 2013, NCAR, Boulder, CO
CAT Outbreak within a Midlatitude Cyclone (9-10 March 2006) Over 200 reports of moderate or greater turbulence from 1500 UTC 9 March to 0300 UTC 10 March Reference: Trier, S.B., R.D. Sharman, and T.P. Lane 2012: Influences of moist convection on a cold-season outbreak of clear-air turbulence (CAT), Mon. Wea. Rev., 140, 2477-2496.
Location of Turbulence Relative to Large-Scale Flow Features 0000 UTC RUC Analysis and 2300-0100 UTC Time-Space Corrected Turbulence Reports 2 PVU A B C D West – East Distance (km)
Experimental Design • ARW-WRF Simulations with 4 interactive nests (with D = 30, 10, 3.333, and 0.667-km) - D3 and D4 have fully explicit convection (no cumulus parameterization) • Simulations: • CRTL (full physics, uses D1, D2, D3) • NOMP (cloud microphysics deactivated, uses D1, D2, D3) • HRES (like CTRL, but D = 0.667 nest D4 activated between 2300 and 0100 UTC)
24-h Forecast (CTRL) over Domain 3 at 0000 UTC 10 March • model derived reflectivity • surface winds • surface q (2-K contour intervals) Observations over Region at 0000 UTC 10 March • NOWRAD reflectivity • surface winds • surface q (2-K contour intervals)
Line-Averaged Cross Section of Cloud (colorfill), q, Winds, TKE (green), Nm (red) Layer of reported turbulence CTRL 24-h Forecast (0000 UTC 10 March 2006)
Wintertime Clear-Air Turbulence (CAT) Associated with Deep Convection Breaking Gravity Waves Above Storms Kelvin-Helmholtz Instability Potential Temperature, Vertical Velocity and Total Cloud Condensate Turbulence mechanisms at different locations on the fine-scale grid (D = 667 m) Horizontal Distance (km)
Radial (Transverse) Cirrus Bands in MCS Anvils A recent example (13 August 2013) 1632 UTC 13 Aug 2013 Moderate Turbulence Moderate Turbulence 1656 UTC 13 Aug 2013 Moderate Turbulence
Radial (Transverse) Cirrus Bands in MCS Anvils A recent example (13 August 2013) 1632 UTC 13 Aug 2013 Moderate Turbulence Moderate Turbulence 1656 UTC 13 Aug 2013 Moderate Turbulence
16 – 17 June 2005 Case Study 0905 UTC 16 June 43 N 40 N 37 N 0745 UTC 17 June 40 N 37 N
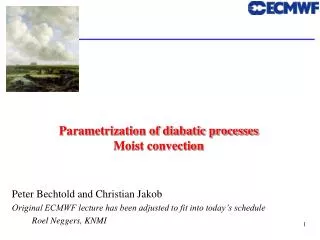
Simulation of Radial Outflow Bands in 17 June 2005 MCS 0800 UTC Simulated Reflectivity and 12.5-km MSL Winds • Simulations with ARW-WRF V2.2 • Explicit Deep Convection • Initial and Boundary Conditions from • D = 13 km 3-hourly RUC Analyses • Large Single Domain Run with D = 3 km • Simulation with D2 nest of D = 600 m • started at t = 7h of Large Domain Run Model Parameterizations - Thompson Bulk Microphysics - Noah LSM - PBL Scheme (MYJ) - Dudhia Longwave Radiation - RRTM Shortwave Radiation
Turbulence UA 776 Observations and WRF-Simulations of the 17 June 2005 MCS Case Simulated Cloud Top Temperature (0950 UTC, t = 5.8 h ) Observed Turbulence @ 37 Kft (0936-0957 UTC) L=light, M=Moderate IR Satellite at 0950 UTC 17 June 2005 Trier and Sharman (2009, Mon. Wea. Rev.) Observations and MCS-Scale Simulations Trier et al. (2010, J. Atmos. Sci.) High-Resolution Simulation and Analysis of Radial Bands
2 4-hour Loop of Brightness Temperature, 12-km Moist Static Instability N < 0 and 11.5-13-km Vertical Shear from 07-11 UTC 17 June with Dt = 10 min m North East Tb • Anvil bands originate within zones of moist static instability • Bands are aligned along the anvil vertical shear vector • Similar to horizontal convective rolls in boundary layer arising from thermal instability
0930 UTC Brightness Temperature and Moist Static Stability Control Simulation (Full Physics) No Cloud-Radiative Feedback Simulation Tb
150-km Line Average Simulated TKE typically occurs where Ri number is reduced m At typical commercial aircraft cruising altitudes (z = 10-12 km) ~ m e e Stability Budget Equation Differential Horizontal Advection Differential Vertical Advection Tendency Subgrid Source Term
Red = Upward Motion Blue = Downward Motion
17 June 2005 Turbulence Measurements Near Transverse (Radial) MCS Outflow Bands radial bands Turbulence intensities from in situ EDR: Green = Smooth Yellow = Light Orange = Moderate Red = Severe
Summary • Near-cloud turbulence (NCT) can result from many different mechanisms • - Many types of convective weather involved (isolated cells, MCSs, midlatitude cyclones) • - Turbulence forecasting systems need to account for this non-traditional CAT • Mesoscale circulations play an important role in producing NCT • - Large-scale upper-level anticyclonic outflows enhance vertical shear supporting NCT • - Many important effects of vertical shear • Provides large-scale thermodynamic destabilization and organizes radial bands • Promotes Kelvin-Helmholtz instability • Gravity Waves play a role in many NCT situtations • - Directly through wave breaking • - Indirectly through local reductions in Ri where other instabilities are favored • - Indirectly through their vertical motions, which perturb already unstable flow