Download
1 / 42
440 likes | 770 Views
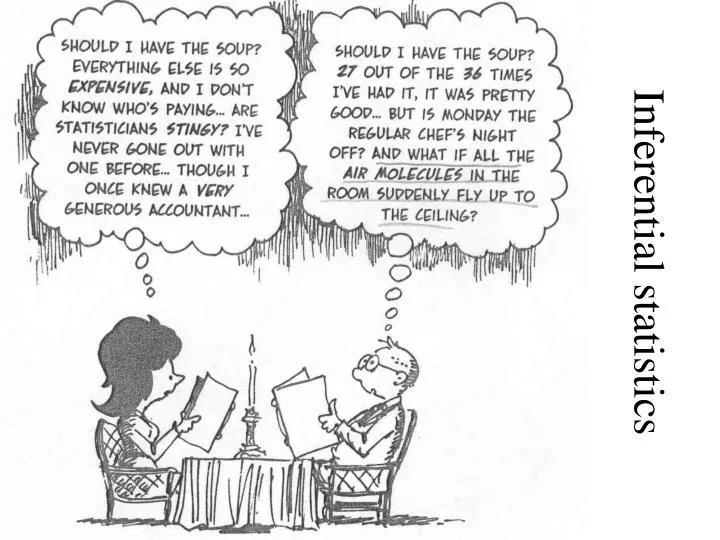
Inferential statistics. Why statistics are important. Statistics are concerned with difference – how much does one feature of an environment differ from another Magnitude : The comparative strength of two variables.

E N D
Why statistics are important • Statistics are concerned with difference – how much does one feature of an environment differ from another • Magnitude: The comparative strength of two variables. • Reliability. The degree to which the measure of the magnitude of a variable can be replicated with other samples drawn from the same population.
Why statistics are important • Relationships – how does much one feature of the environment change as another measure changes Correlation or regression r=0.73 N=20 p<0.01
Arithmetic mean or average Mean (M or X), is the sum (SX) of all the sample values ((X1 + X2 +X3.…… X22) divided by the sample size (N). SX = 45, N = 22. M = SX/N = 45/22 = 2.05
The median • median is the "middle" value of the sample. There are as many sample values above the sample median as below it. • If the sample size is odd (say, 2a + 1), then the median is the (a+1)st largest data value. If the sample size is even (say, 2a), then the median is defined as the average of the ath and (a+1)st largest data values.
Other measures of central tendency • The mode is the single most frequently occurring data value. • The midrange is the midpoint of the sample -- the average of the smallest and largest data values in the sample. • Find the Mean, Median and Mode
All normal distributions have similar properties. The percentage of the scores that is between one standard deviation (s) below the mean and one standard deviation above is always 68.26% Mean =77.48 SD=7.15 N=62 -2SD -1SD 0 +1SD +2SD -14.30 -7.15 0 +7.15 +14.30
Is there a significant difference between Polynesian and “other” scores Mean =81.9 SD=6.5 N=20 Mean =75.0 SD=6.8 N=20
Three things we must know before we can say events are different • the difference in mean scores of two or more events - the bigger the gap between means the greater the difference • the degree of variability in the data - the less variability the better
Variance and Standard Deviation These are estimates of the spread of data. They are calculated by measuring the distance between each data point and the mean variance (s2) is the average of the squared deviations of each sample value from the mean = s2 = S(X-M)2/(N-1) The standard deviation (s) is the square root of the variance.
Calculating the Variance and the standard deviation for the Rich sample
Three things we must know before we can say events are different • The extent to which the sample is representative of the population from which it is drawn - the bigger the sample the greater the likelihood that it represents the population from which it is drawn - small samples have unstable means. Big samples have stable means.
Estimating difference The measure of stability of the mean is the Standard Error of the Mean = standard deviation/the square root of the number in the sample. So stability of mean is determined by the variability in the sample (this can be affected by the consistency of measurement) and the size of the sample. The standard error of the mean (SEM) is the standard deviation of the normal distribution of the mean if we were to measure it again and again
Yes it’s significant. The Standard Errors of the Mean = 1.45 and 1.53, so the 95% confidence interval will be about 3 points (1.96*1.5) either side of the mean. The means falls outside each other’s confidence intervals
Is the difference between means significant? What is clear is that the mean of the Rich group is well outside of the area where there is a 95% chance that the mean for the Poor Group will fall, so it is likely that the Rich mean comes from a different population than the Poor mean. The convention is to say that if mean 2 falls outside of the area (the confidence interval) where 95% of mean 1 scores is estimated to be, then mean 2 is significantly different from mean 1. We say the probability of mean 1 and mean 2 being the same is less than 0.05 (p<0.05) and the difference is significant p
The significance of significance • Not an opinion • A sign that very specific criteria have been met • A standardised way of saying that there is a There is a difference between two groups – p<0.05; There is no difference between two groups – p>0.05; There is a predictable relationship between two groups – p<0.05; or There is no predictable relationship between two groups - p>0.05. • A way of getting around the problem of variability
95% of M1 distri-bution 2.5% of M1 distri=bution 2.5% of M1 distri-bution If you argue for a one tailed test – saying the difference can only be in one direction, then you can add 2.5% error from side where no data is expected to the side where it is 1-tailed test 2-tailed test
Tests of significance • Tests of difference – t-tests, analysis of variance, chi-square, odds ratios • Tests of relationship – correlation, regression analysis • Tests of difference and relationship – analysis of covariance, multiple regression analysis.
Chi-squared (c2) comparison of age in the sample vs the Waitakere population
Values of chi-square for the research project The fact that two groups are not significant means that there is no significant difference between the sample and Waitakere population except for culture and qualifications
r =(S(X – MX)*((Y – MY))/(N*SX*SY) r =correlation coefficient X = Height Y= Self Esteem MX=Mean of X MY =Mean of Y SX=Standard deviation of X SY=Standard deviation of y
r=0.73 N=20
One or two tails? What degrees of freedom What level of significance should be chosen?