Download
1 / 4
40 likes | 52 Views
This study presents a neighbor-joining tree and 3D view of genome features of 25 Xanthomonas strains causing citrus canker. Core-genome depletion and pan-genome accumulation curves are also analyzed. ClonalFrame analysis reveals recombination and mutation events in XacA and XacAw strains.

E N D
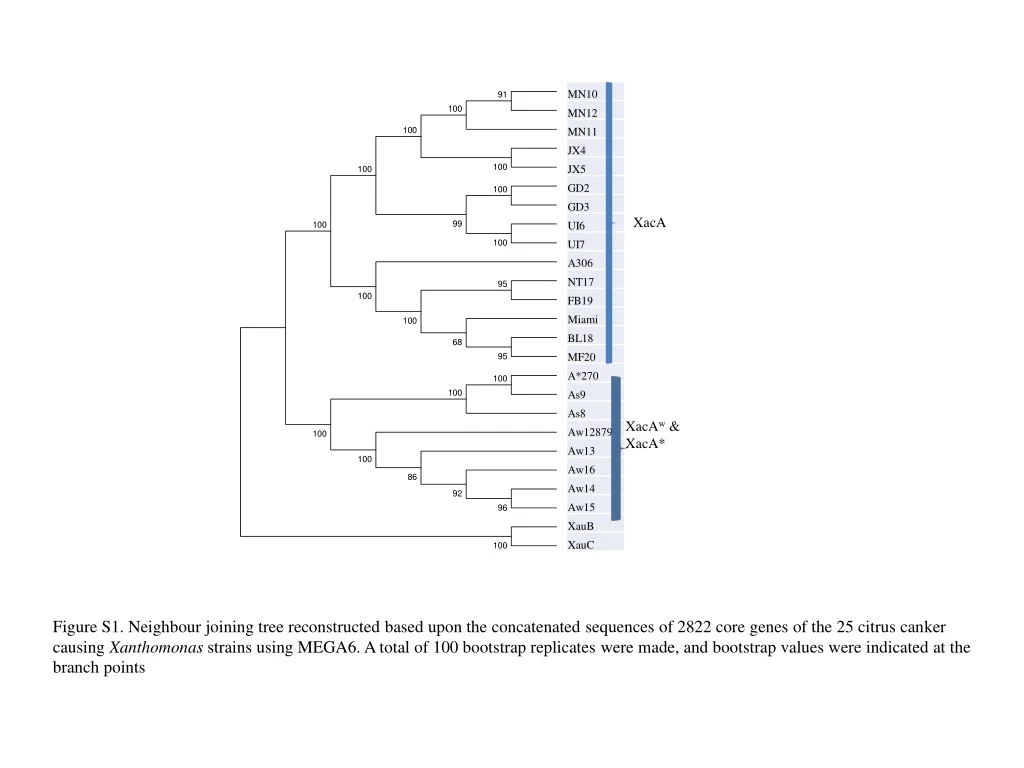
XacA XacAw & XacA* Figure S1. Neighbour joining tree reconstructed based upon the concatenated sequences of 2822 core genes of the 25 citrus canker causing Xanthomonas strains using MEGA6. A total of 100 bootstrap replicates were made, and bootstrap values were indicated at the branch points
XacAw & XacA* XacA Figure. S2. 3D view of the genome features of the 23 Xac strains. The red triangles denote XacA* strains, the pink circles denote XacAw strains and the yellow diamond denote XacA strains.
Core genome Pan-genome Figure S3. Depletion curves of core-genome (left) and accumulation curves of pan-genome (right) of the 23 Xac strains. The fitted curves (red line) were added by using get_homologues based on model proposed by Tettelin in 2005 (Pubmed=16172379)
AS8 A*270 AS9 XacAw & A* XCAW AW16 AW13 AW15 AW14 A306 NT17 FB19 5208 MF20 BL18 XacA GD3 GD2 UI7 UI6 JX5 JX4 MN12 687092- 1213596 4143464- 4454744 3525087- 3803856 179310- 687087 3107752- 3355123 1383432- 1908613 3909361- 4143431 start- end 2839814- 3068286 4652022- 4864440 MN11 MN10 Figure S4. Results of the ClonalFrame analysis on the basis of un-gapped sequences of the longest 9 aligned blocks of 23 Xac genomes generated by progressiveMAUVE. The inferred clonal genealogy was shown on the left and the distribution of the recombination (red) and mutation (green) events estimated by ClonalFrame on the corresponding branches were shown on right. The distribution of the 9 blocks were indicated according to the start and end position on XacA306 chromosome. All possible events revealed by ClonalFrame were shown, and the relationship between event panels and their corresponding nodes were indicated with dash lines. The recombination events (red in the event panels) only occurred in XacA node and Aw & A* node (red dash lines).