Download

1 / 10
110 likes | 131 Views
Explore the resistivity profile in an urban area for educational and data analysis purposes, focusing on conductivity, geology, and field data collection techniques.

E N D
Resistivity Profile in an Urban Setting Bill Montgomery Dept of Geoscience / Geography New Jersey City University
Background • NJCU is a Federally designated Minority and Hispanic – Serving Institution in Jersey City, NJ (near Miss Liberty) • Approx 5000 students FTE, primarily undergraduate • 40% Caucasian, 30% Hispanic, 20% Afr-American • Feds (NSF et al.) screaming for more bodies & more diversity in STEM • Need to expand inquiry & activity-based learning across the Science curriculum to attract more Science students • Our GIS success at NJCU suggests that hands-on, student-centered learning improves outcomes, regardless of discipline • Geophysics re-introduced in Sp 2006 after 7-yr hiatus, plan was to get the students into the field • Enter Dr. Lee Slater from Rutgers-Newark (!)
Jersey City History • Geologic backbone = tilted edge (hogback?) of the Palisades Sill, world-famous layered intrusion associated with opening of the current Atlantic Ocean • Industrial sites dating back to 18th century, many on sites created with artificial fill from tailings associated with chrome processing • Artificial fill frequently contains Cr VI (nasty heavy metal), along with Pb, petroleum, BTEX, timber fragments, concrete block, metallic debris, etc. • The shallow exploration geophysicist’s paradise (?)
Site Location • Former industrial site • Part of a larger area designated to become largest park (8+ acres) in Jersey City • Larger issue: area will experience massive redevelopment as part of residential housing boom (NYC spilling over into JC) • NJDEP historic fill map shows no fill at the site, but nearby well control to NE and SW suggests otherwise: • Chromate waste • Wood & concrete fragments • Fly ash • Miscellaneous debris, including steel
Exercise Goals • Reinforce student concepts: • Conductivity • Resistivity • Introduce / reinforce use of multiple data sources (geological & geophysical) to analyze and solve problems • Begin to familiarize students with modern equipment and field data collection techniques • Embrace multiple working hypotheses to explain resistivity profile • Reinforce student use of “cross-sectional view” of subsurface
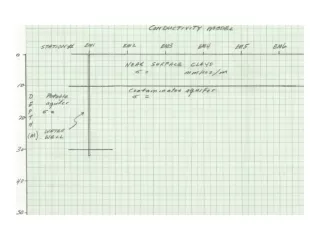
Exercise • One resistivity line (thus far), parallel & extended from Berry Road, 400+ feet long • Discernible differences in resistivity with depth • Suggestive of layering / stratigraphy • 2 sets of well control, 500 & 1000 feet away • Shallow water table (~ 5 feet below grade) • No reliable “depth to bedrock”, perhaps because of: • Similarities between artificial fill and Pleistocene deposits (sand/silt) • Poor sample descriptions (hint: hire more geoscientists….) • Students instructed to take available data & construct a hydrostratigraphic cross-section
The Profile NE SW Water Table? Base Fill ?
Student Learning Outcomes • TBD (To Be Determined) • Initial use of line on Sp 2006 Exam w/o well control and instructor mention of possible metallic debris in fill led to student answer of “metal” when asked why the low resistivity…. • Initial results (get them out of the lecture room and into the field) encouraging in terms of student attitude • Students clearly are interested in, and motivated by, local problems and community issues
Epilogue • Stay tuned for further additions to the new “Geophysics in the NJ Urban Jungle” series • Check out “Find the UST with GPR” • Thanks to Lee Slater and all of you real geophysicists who are helping me help NJCU students • Questions?