Download
1 / 28
290 likes | 397 Views
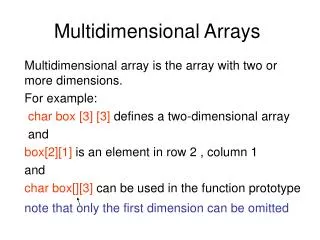
Multidimensional Detective. Alfred Inselberg Presented By Cassie Thomas. Motivation. Discovering relations among variables Displaying these relations. Cartesian vs. Parallel Coordinates. Cartesian Coordinates: All axes are mutually perpendicular Parallel Coordinates:

E N D
Multidimensional Detective Alfred Inselberg Presented By Cassie Thomas
Motivation • Discovering relations among variables • Displaying these relations
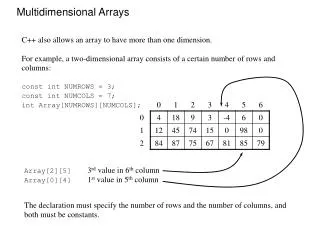
Cartesian vs. Parallel Coordinates • Cartesian Coordinates: • All axes are mutually perpendicular • Parallel Coordinates: • All axes are parallel to one another • Equally spaced
An Example Parallel Cartesian Representation of a 2-D line
Why Parallel Coordinates ? • Help represent lines and planes in > 3 D Representation of (-5, 3, 4, -2, 0, 1)
Why Parallel Coordinates ? (contd..) Easily extend to higher dimensions (1,1,0)
Why Parallel Coordinates ? (contd..) Cartesian Parallel Representation of a 4-D HyperCube
Why Parallel Coordinates ? (contd..) X9 Representation of a 9-D HyperCube
Why Parallel Coordinates ? (contd..) Representation of a Circle and a sphere
More on Parallel Coordinates • The design of the queries is important- one must accurately cut complicated portions of a N-dimensional “watermelon” • If a query is not understood correctly then the use of parallel coordinates is limited to small datasets. As well as the geometry.
Favorite Sentence “The paradigm is that of a detective, and since many parameters(equivalently dimensions) are involved we really mean a multidimensional detective”
Discovery Process • Multivariate datasets • Discover relevant relations among variables • Discover sensitivities, understand the impact of constraints , optimization • A dataset with P points has 2P subsets, of which any of those can have interesting relationships.
An Example • Production data of 473 batches of a VLSI chip • Measurements of 16 parameters - X1,..,X16 • Objective • Raise the yield X1 • Maintain high quality X2 • Belief: Defects hindered yield and quality. Is it true?
The Full Dataset X1 is normal about its medianX2 is bipolar
Example (contd..) • Batches high in yield, X1 and quality, X2 • Batches with low X3 values not included in selected subset
Example (contd..) • Batches with zero defect in 9 out of 10 defect types • All have poor yields and low quality
Example (contd..) • Batches with zero defect in 8 out of 10 defect types • Process is more sensitive to variations in X6 than other defects
Example (contd..) • Isolate batch with the highest yield • X3 and X6 are non-zero • Defects of types X3 and X6 are essential for high yield and quality
Critique • Strengths • Low representational complexity • Discovery process well explained • Use of parallel coordinates is very effective • Weaknesses • Does not explain how axes permutation affects the discovery process • Requires considerable ingenuity • Display of relations not well explained • References not properly cited
Related Work • InfoCrystal [Anslem Spoerri] • Visualizes all possible relationships among N concepts • Example: Get documents related to visual query languages for retrieving information concerning human factors
References • Mathematics • Graphics • Data Mining • Referenced in such work as parallel coordinates plots, hierarchical parallel coordinates
Contributions • Inselberg pioneered a method for displaying multivariate data • Made displaying high dimensional data sets useful and understandable. • Spawned several new techniques for displaying multidimensional data. Plots, hierarchical. • Software- Parallax
What has happened to this topic? • Cornell University: Parallel Coordinates using MATLAB
What has happened to this topic? (cont) • Fujitsu SymfoWARE visual miner • Spotfire-parallel coordinates feature • Lifelines – UMD • “constructing parallel coordinates plot for problem solving” paper presented at Smart Graphics ’01
Demo http://csgrad.cs.vt.edu/~agoel/parallel_coordinates/stf/table1.stf