Download
1 / 15
210 likes | 567 Views
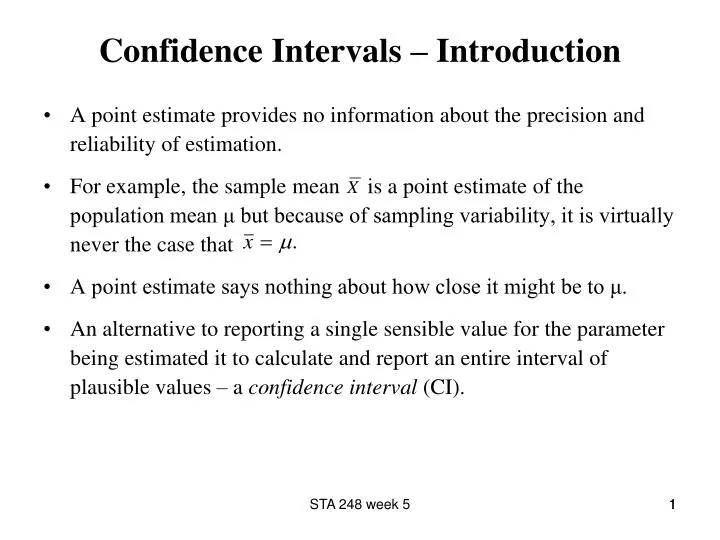
Confidence Intervals – Introduction. A point estimate provides no information about the precision and reliability of estimation. For example, the sample mean is a point estimate of the population mean μ but because of sampling variability, it is virtually never the case that

E N D
Confidence Intervals – Introduction • A point estimate provides no information about the precision and reliability of estimation. • For example, the sample mean is a point estimate of the population mean μ but because of sampling variability, it is virtually never the case that • A point estimate says nothing about how close it might be to μ. • An alternative to reporting a single sensible value for the parameter being estimated it to calculate and report an entire interval of plausible values – a confidence interval (CI). STA 248 week 5 1
Confidence level • A confidence level is a measure of the degree of reliability of a confidence interval. It is denoted as 100(1-α)%. • The most frequently used confidence levels are 90%, 95% and 99%. • A confidence level of 100(1-α)% implies that 100(1-α)% of all samples would include the true value of the parameter estimated. • The higher the confidence level, the more strongly we believe that the true value of the parameter being estimated lies within the interval. STA 248 week 5 2
Deriving a Confidence Interval • Suppose X1, X2,…,Xn are random sample and we observed the data x1, x2,…,xn which are realization of these random variables. • We want a CI for some parameter θ. • To derive this CI we need to find another random variable that is typically a function of the estimator of θ satisfying: 1) It depends on X1, X2,…,Xn and θ 2) Its probability distribution does not depend on θ or any other unknown parameter. • Such a random variable is called a “pivot”. • Example…. STA 248 week 5
CI for μ When σ is Known • Suppose X1, X2,…,Xn are random sample from N(μ, σ2) where μ is unknown and σ is known. • A 100(1-α)% confidence interval for μ is, • Proof: STA 248 week 5 4
Width and Precision of CI • The precision of an interval is conveyed by the width of the interval. • If the confidence level is high and the resulting interval is quite narrow, the interval is more precise, i.e., our knowledge of the value of the parameter is reasonably precise. • A very wide CI implies that there is a great deal of uncertainty concerning the value of the parameter we are estimating. • The width of the CI for μ is …. STA 248 week 5 5
Important Comment • Confidence intervals do not need to be central, any a and b that solve define 100(1-α)% CI for the population mean μ. STA 248 week 5 6
One Sided CI for μ • CI gives both lower and upper bounds for the parameter being estimated. • In some circumstances, an investigator will want only one of these two types of bound. • A large sample upper confidence bound for μ is • A large sample lower confidence bound for μ is STA 248 week 5 7
Large Sample CI for μ • Recall: if the sample size is large, then the CLT applies and we have • A 100(1-α)% confidence interval for μ, from a large iid sample is • If σ2 is not known we estimate it with s2. STA 248 week 5 8
Example • The National Student Loan Survey collected data about the amount of money that borrowers owe. The survey selected a random sample of 1280 borrowers who began repayment of their loans between four to six months prior to the study. The mean debt for the selected borrowers was $18,900 and the standard deviation was $49,000. Find a 95% for the mean debt for all borrowers. STA 248 week 5 9
Example – Binomial Distribution • Suppose X1, X2,…,Xn are random sample from Bernoulli(θ) distribution. A 100(1-α)% CI for θ is…. • Example… STA 248 week 5 10
One Sample Variance • In many case we will be interested in making inference about the population variance. • Suppose X1, X2,…,Xn are random sample from N(μ, σ2) where both μ and σ are unknown. A CI for σ2 is … STA 248 week 5
Example STA 248 week 5
t distribution • Suppose Z ~ N(0,1) independent of X ~ χ2(n). Then, • Proof: week1
Claim • Suppose X1, X2,…Xn are i.i.d normal random variables with mean μ and variance σ2. Then, • Proof: week1
CI for μ When σ is Unknown • Suppose X1, X2,…,Xn are random sample from N(μ, σ2) where both μ and σ are unknown. • If σ2 is unknown we can estimate it using s2 and use the tn-1 distribution. • A 100(1-α)% confidence interval for μ in this case, is … STA 248 week 5 15