Download
1 / 7
641 likes | 2.84k Views
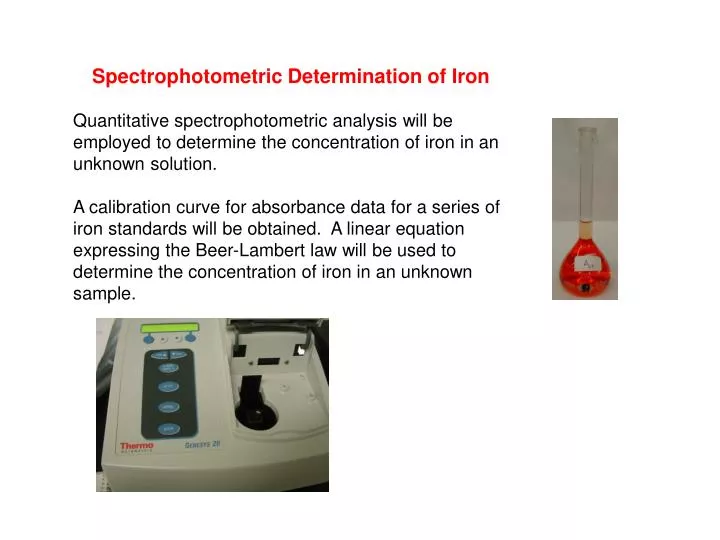
Spectrophotometric Determination of Iron Quantitative spectrophotometric analysis will be employed to determine the concentration of iron in an unknown solution.

E N D
Spectrophotometric Determination of Iron Quantitative spectrophotometric analysis will be employed to determine the concentration of iron in an unknown solution. A calibration curve for absorbance data for a series of iron standards will be obtained. A linear equation expressing the Beer-Lambert law will be used to determine the concentration of iron in an unknown sample.
Beer-Lambert Law: the fraction of incident light absorbed, A, is a function of the thickness and the concentration of absorbing molecules in the light’s path. A = εb C ε= the molar absorptivity constant b = optical path length, often 1 cm C = the concentration in moles/liter Inside a spectrophotometer
Preparation of Standards: Mix and let stand. • Add appropriate amounts of standard iron solution to volumetric flasks using good burette techniques. • Add hydroxylamine to reduce Fe3+ to Fe2+ • Add sodium acetate salt, pH = 8 • Add o-phenanthroline, AKA phen, bidentate ligand
Absorbance Spectrum phen Tris (1,10-phenanthroline)iron(II) Red-orange complex λmax = 508 nm
Using the Genesys 20 Spectrophotometer Allow the instrument to warm up for 30 minutes before using it. Press A/T/C to select absorbance as the mode shown on the display. Press nm▲or nm▼ to select the proper wavelength. Insert you blank into the cell holder and close the sample door. Press 0 ABS/100%T to set the black to 0 A. Remove your blank, using the same curette, insert your sample into the cell holder. The sample measurement appears on the LCD display.
Curette Preparation Reminders: • Prepare a blank by filling an empty curette ¾ full with De-Ionized Water. • Seal the curette with a lid. • Remember: • All curettes should be wiped clean and dry on the outside with a tissue. • Handle curettes only by the top edge of the ribbed sides. • All solutions should be free of bubbles. • Always position the curette so the light path (indicated by the arrow) passes through the clear walls.
Data Analysis • Calculate the molarity of iron in the standard solutions, M1V1=M2V2 • Construct a Calibration Curve (Absorbance vs. Concentration). (Directions for Excel 2007 available.)Use the equation of the best fit line for your calibration curve to calculate the amount of iron in your unknown.