Download
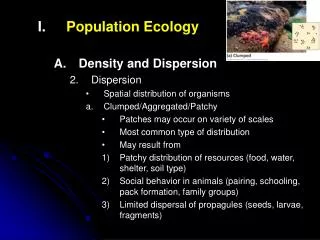
1 / 31
320 likes | 509 Views
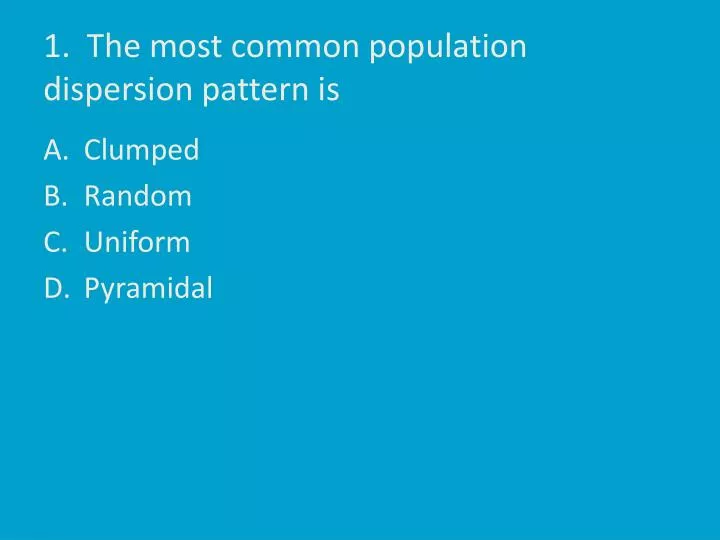
1. The most common population dispersion pattern is. Clumped Random Uniform Pyramidal. 2. Which of the following is the correct shape for a logistic growth curve?. . . . . 3. On this graph, 200 paramecium per ml of medium is the. Biotic potential Intrinsic rate of increase (r)

E N D
1. The most common population dispersion pattern is • Clumped • Random • Uniform • Pyramidal
2. Which of the following is the correct shape for a logistic growth curve? • . • . • . • .
3. On this graph, 200 paramecium per ml of medium is the • Biotic potential • Intrinsic rate of increase (r) • Carrying capacity (K) • Both A and B
4. If species A has the ability to produce a greater number of offspring per year than species B it • has a lower r • has a greater r • has a lower K • has a greater K
5. Species X is better able to compete for resources than species Y, which can help the species have a___________ • A higher r • A lower r • A higher K • A lower K
Population with higher K Population with higher r
6. The carrying capacity is_____ and it depends upon the _____________. • A fixed value; biotic potential • A fixed value; environmental resistance • Variable; biotic potential • Variable; environmental resistance
Reproductive age Time between successive generations Number of offspring Availability of resources- light, food etc. Competition Predation
7. Frogs produce a large number of eggs and do not provide parental care for their offspring. These characteristics show that frogs are a(n) • K strategist • r strategist • Irruptive reproducer • Cyclic reproducer
8. K strategists have an advantage in a(n) ________ environment because they ___________. • unstable; are better competitors • unstable; have a faster reproductive rate • stable; are better competitors • stable; have a faster reproductive rate
9. A flood or hurricane is a • Density-dependent population control • Density-independent population control • Top-down population regulation • Bottom-up population regulation
10. If a population has a crude birth rate of 30 per 1000, a crude death rate of 20 per 1000, an immigration rate of 6 per 1000 and an emigration rate of 1 per 1000 what is its growth rate? • 15% • 1.5% • 5% • 0.5%
11. The current world population is (give closest value) • 5 billion • 6 billion • 7 billion • 8 billion • 10 billion
12. The US population is • 210 million • 310 million • 410 million • 510 million
13. The replacement level fertility is • Exactly 2 children per couple (on average) • Greater in developed nations • Greater in developing nations
Replacement level fertility is 2.1 in developed nations compared to 2.5 in some developing nations- due to infant mortality.
14. During the transitional phase (phase 2) of the Demographic Transition model • the birth rate drops • the birth rate increases • the death rate drops • the death rate increases • both A and C
Preindustrial Transitional Industrial Postindustrial
15. Nations usually exhibit exponential growth when they are in the • Preindustrial phase • Transitional phase • Industrial phase • A and B • B and C
In both the Transitional phase and the Industrial phase the birth rate is greater than the death rate so exponential growth is a occurring in both of these phases. However, in the Industrial Phase, the birth rate is decreasing, so the RATE OF INCREASE is decreasing (slowing down of growth rate).
16. Which nation has the greatest population growth rate, using age structure graphs shown. • Kenya • United States • Germany • Can not determine, only percentages given
17. If a country has a growth rate of 2% a year, it will increase in size from 100 million to 400 million in • 140 years • 70 years • 105 years • 35 years • 7 years • 5 years • 3.5 years
The population increasing from 100 million to 400 million is two doubling periods. At a rate of 2% growth per year, a population will increase from 100 million to 200 million in 35 years (70/ 2). In another 35 years it will double from 200 million to 400 million.
18. China and India make up _____ of the world’s population. • 48% • 38% • 28% • 18% • 8%
19. A scientist captures and tags 50 albatross. After allowing them to assimilate back with the rest of the population he recaptures 40 albatross and finds that 15 of them are tagged. His population estimate is • 2000 • 750 • 187 • 133 • 1870 • 75
15 50 = 40 N
20. If 400 meerkats live an area of 2 mi2, the population density is • 200 meerkats/mi2 • 100 meerkats/ mi2 • 800 meerkats/mi2 • 0.05 meerkats/mi2
21. Which of the following is generally correlated with a lower birth rate? • Increased infant mortality rate • Greater education level esp. for women • Decreased urbanization • Lower cost of raising a child
22. Country Q has a growth rate of 0.8% and a crude death rate of 20 per 1000. There is no net immigration/emigration. What is its birth rate (per 1000)? • 100 • 80 • 60 • 28 • 18 • 8
The growth rate of 0.8 % (an increase of 0.8 people per hundred) is equal to an increase in the population of 8 per 1000. Since there is no net migration, the births (per 1000) must be 8 more than the deaths (per 1000) for this country. So if the death rate is 20 per 1000 the birth rate is 28 per 1000.
12. B 13. C C E A B B D A B D A A C B C D B C B B C