Download
1 / 2
20 likes | 80 Views
Study on the impact of Tolfenamic Acid on lung tumor area calculation and protein expression analysis in A549 and CRL5803 cells. The evaluation was done through Western blot analysis, showing significant differences in protein levels.

E N D
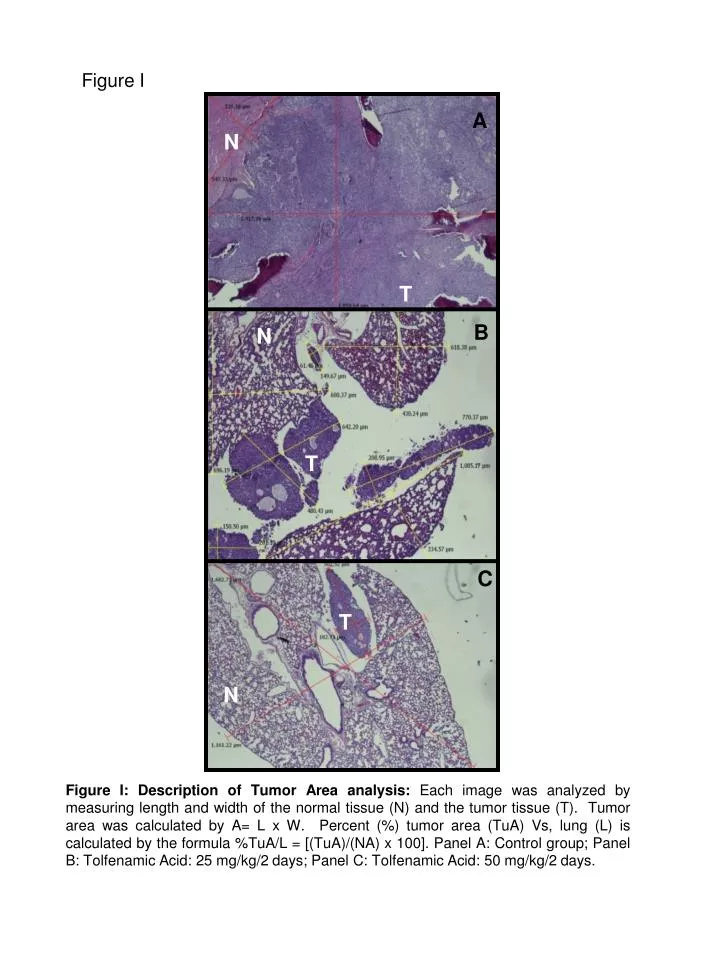
A N Figure I T B N T C T N Figure I: Description of Tumor Area analysis: Each image was analyzed by measuring length and width of the normal tissue (N) and the tumor tissue (T). Tumor area was calculated by A= L x W. Percent (%) tumor area (TuA) Vs, lung (L) is calculated by the formula %TuA/L = [(TuA)/(NA) x 100]. Panel A: Control group; Panel B: Tolfenamic Acid: 25 mg/kg/2 days; Panel C: Tolfenamic Acid: 50 mg/kg/2 days.
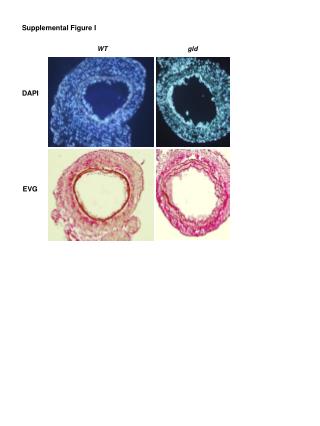
Figure II a b Figure II:Tolfenamic acid induces the degradation of p-Met and c-Met expression in A549 and CRL5803 cells: Lung cancer cells, A549 and CRL5803 were treated with DMSO or 50 µm of tolfenamic acid (TA) for 48 hr. Whole cell lysates were prepared and the expression of p-Met and c-Met were evaluated through Western blot analysis as described in the Materials and Methods section (main manuscript). Data shown in the figures are the quantitaive analysis of Western blot results. The results shown are mean SD for at least three replicates (independent experiments) and the bars marked with ‘*’ are significantly different (p < 0.05) from the expression of corresponding control groups.