Download
1 / 17
170 likes | 325 Views
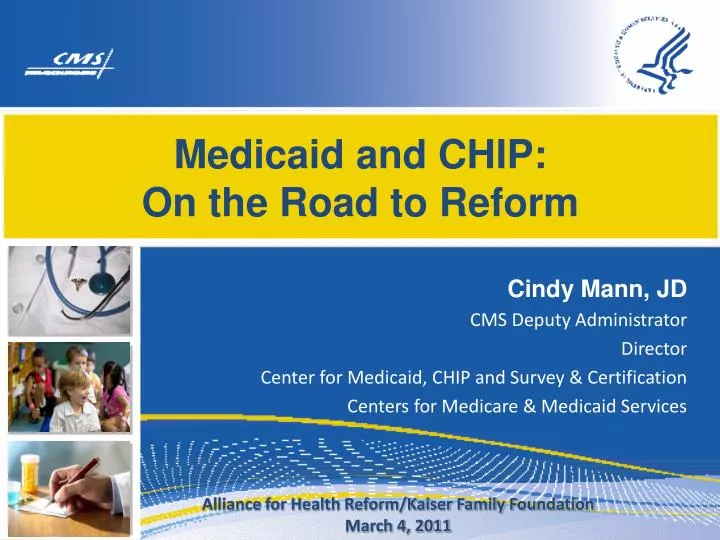
Medicaid and CHIP: On the Road to Reform. Cindy Mann, JD CMS Deputy Administrator Director Center for Medicaid, CHIP and Survey & Certification Centers for Medicare & Medicaid Services. Alliance for Health Reform/Kaiser Family Foundation March 4, 2011. Implementing the Affordable Care Act.

E N D
Medicaid and CHIP: On the Road to Reform Cindy Mann, JD CMS Deputy Administrator Director Center for Medicaid, CHIP and Survey & Certification Centers for Medicare & Medicaid Services Alliance for Health Reform/Kaiser Family Foundation March 4, 2011
Implementing the Affordable Care Act • Working with States (Governor’s offices, Medicaid, CHIP, Insurance Commissioners) • Coordinating with the Center for Consumer Information and Insurance Oversight (CCIIO), IRS/Treasury, other federal agencies • Listening to what reform means to a broad array of stakeholders • Promulgating regulations and guidance; providing technical assistance
Sources of Coverage by 2019 for Individuals Under 65 24m 51m 23m 25m 159m Source: Congressional Budget Office, March 2010
New Paradigm Medicaid/ CHIP Employer Coverage Exchange • Not a safety net but a full partner in assuring coverage, quality and cost containment • Simplified rules and process (eligible = enrolled) • A system of coverage and care
66% Percentage of Population Under 133% of the FPLUninsured vs. Medicaid Covered 42% 43% 35% 23% 17% Source: HHS ASPE analysis of the 2010 Annual Social and Economic Supplement to the Current Population Survey
Minimum Medicaid Eligibility LevelsNow and 2014 Average - Will vary by State * 5 States provide Medicaid or Medicaid look-alike coverage to certain childless adults; 15 States provide a limited benefit package to certain childless adults.
400% FPL Exchange Subsidies 2014 Health Insurance Subsidies 241% FPL Medicaid/CHIP Children Varies by State 133% FPL Medicaid Adults 0 Adults Children
First Steps:Modernized, Efficient Systems • IT Guidance 1.0 for Medicaid and the Exchange • NPRM on Medicaid Eligibility Systems • 90% FFP for eligibility and enrollment system design and development until 12/31/15 • 75% FFP for system maintenance • Established 7 Conditions & Standards • 7 Exchange Innovator Grants and Collaborative
Who Pays? Estimated Distribution of Costs for Medicaid Coverage Changes: 2014-2019 (in billions) Total $464.7 billion Source: Congressional Budget Office and Medicaid Coverage and Spending in Health Reform, John Holahan and Irene Headen/Kaiser Commission, May 26, 2010
Current Fiscal Pressures • Enrollment among families and children has grown sharply due to the recession • Medicaid is intended to be a countercyclical program • Despite enrollment growth, state Medicaid spending declined during the recession • The Recovery countercyclical FMAP increase resulted in a 10% drop in state spending on Medicaid in 2009 • While enrollment growth explains recent growth in costs, the real cost drivers lie elsewhere
Concentration of Medicaid Spending 1% 5 % 54% Percentile of Medicaid Population (Ranked by Spending) 10% Percent of Total Medicaid Spending 95% 50% 5% 0% 20% 40% 60% 80% 100% Source: Medicaid Statistical Information System Claims Data for FY 2008
Coverage: Pathway to Better Care, Better Health, Lower Costs Population Health Per Capita Cost Experience Of Care
What CMS is Doing to Help States Reduce Costs Now • Focus on Medicaid Cost Drivers • Existing Authority & New Initiatives • Benefits & Cost-Sharing • Integrated Care for High-Cost Beneficiaries; improving care transitions; reducing unnecessary hospitalizations • Purchasing Drugs More Efficiently • Assuring Program Integrity • Working individually with States (“MSTAT”)
Health Care Expenditures $7,464 Average Cost of One Hospital Admission for a Non-Dual Disabled Medicaid Enrollee Annual Cost of Providing Health Coverage to One Parent under Medicaid Source: CMS data analysis and Urban Institute analysis of data from MSIS and CMS Form 64, prepared for Kaiser Commission on Medicaid and the Uninsured, 2010. Kaiser Family Foundation-State Health Facts, FY 2007.
Duals as Share of Medicaid Spending Dual Eligibles 39% Non-Duals 61% Focus on Dual Eligibles Non-Disabled Adults Children Duals Total Spending = $311 billion Source: CMS data and Urban Institute analysis of data from MSIS and CMS Form 64, prepared for Kaiser Commission on Medicaid and the Uninsured, 2010. Kaiser Family Foundation-State Health Facts, FY 2007.
Achieving a High Performing Medicaid Program • States and the Federal Government working together to achieve: • Simplified, accurate, customer-friendly, data driven eligibility/renewal processes that are fully coordinated with the Exchange • Eligible = Enrolled • Access to person-centered, high quality, integrated care with options for continuity of coverage with plans on the Exchange • Continuing quality and cost improvement in our health care system, based on consumer and other stakeholder input, data, and collaboration.