Download
1 / 21
220 likes | 456 Views
The Aquatic Cycling of Mercury in the Everglades (ACME) Project: Integrated Research Providing Information for Management and Science. View of Everglades National Park. Authors: William Orem (USGS-Reston, VA), David Krabbenhoft (USGS-Middleton, WI),

E N D
The Aquatic Cycling of Mercury in the Everglades (ACME) Project: Integrated Research Providing Information for Management and Science View of Everglades National Park Authors: William Orem (USGS-Reston, VA), David Krabbenhoft (USGS-Middleton, WI), Cynthia Gilmour (Smithsonian Environmental Research Center-Edgewater, MD) George Aiken (USGS-Boulder, CO)
The Problem •Very high levels of methylmercury (MeHg) have been found in fish, wading birds, alligators, and many mammals throughout the Everglades. •At least one Florida panther (an endagered species) has died due to MeHg intoxication. MeHg may act as an endocrine disruptor in fish, leading to declines in fish populations through effects on fecundity. Wading bird populations in the Everglades have declined by 90% since 1900, and MeHg may be one factor in this decline. •Advisories limiting human consumption of fish have been posted throughout the ecosystem due to high MeHg concentrations, generally exceeding the 1.5 ppm criterion. MeHg poses a particular threat to unborn children.
Questions •Why does the Everglades have such a large MeHg problem? Answer – This talk will address this question. A number of factors contribute to high levels of MeHg in the Everglades, including high Hg deposition, favorable environmental conditions, other contaminants (notably sulfur), and favorable food web dynamics. •Was MeHg always high in the Everglades, or is this a recent phenomenon connected to anthropogenic activities? Answer – Studies have shown that current levels of MeHg in the Everglades are at least 5x as high as those in the late 1800’s. Increased anthropogenic inputs of Hg to the atmosphere, and changes to the Everglades ecosystem, both likely contribute to the MeHg problem in the Everglades. •What can be done to correct the MeHg Problem in the Everglades? Answer – Mitigation of local sources of Hg emissions may already be having an impact on MeHg in Everglades’ fish, but because the problem is complex a multifaceted approach to restoration is likely needed. Management of sulfur contamination is also critical.
The Florida Everglades: Then and Now ’ Current s Pre 1900 Anthropogenic changes since 1900 have drasticallyaltered the Everglades ecosystem. Concentrations of methylmercury in fish and other biota have increased at least 5x. How will the $8 billion restoration balance competing factors, including water quality issues like methylmercury, to achieve a successful outcome? EAA WCA 1 WCA 2A WCA 3A Everglades National Park
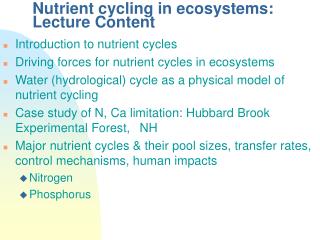
The Mercury Cycle Hg0, Hg(II) Local and Long-Distance Emissions Hg(II) Hg0 Agricultural sulfur use Hg deposition Sulfate from Everglades Agricultural Area (EAA) runoff >1.5 ppm MeHg = 10-7 ppm in surface water Sulfate Hg Anoxic Sediments Bacteria Bioaccumulation MeHg Sulfide Microbial methylation
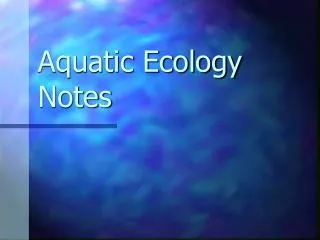
ENR Lox F1 U3 2BS 3A15 MeHg distributions in the Everglades are highest in the middle (Goldilocks Area). TS7 TS9
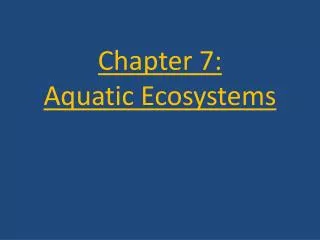
Sulfate Loading from the EAA > 100’s mg/L ~50-150 mg/L ~2-10 mg/L >0.5 -2 mg/L DOC gradient (mg.L) S N ~25 ~50 North-South gradient in sulfate and DOC. Sulfate originates from agricultural runoff.
Methylmercury Sulfate Loading Sulfate-MeHg Response Sulfide Inhibition Zone Sulfate Limitation Zone Zone of Optimum MeHg Production (Goldilocks Area) Sulfate stimulates MeHg production, but buildup of sulfide (a byproduct of sulfate reduction) inhibits MeHg production. Thus, maximum MeHg production occurs at intermediate levels of sulfate (Goldilocks Area) where things are “just right”.
HgT and MeHg Time Series ‘95 MeHg/Hg = 0.50; ’03 = 0.27
Dry down and internal SO4 & labile C production (March) Inundation: net methylation & bioaccumulation (June-February) Rewetting, anoxic conditions reset, onset of methylation (April-May) Linked hydrologic and MeHg Production Cycle
Persistence of MeHg Production After Rewet (June 1999) Following 1998-1999 Drought Long-term average
Driving factors for the summer spikes: • SO4 liberation – oxidation of sedimentary organic sulfur and monosulfides • Near surface (top 10 cm) Eh downward shift ~100 mV • Hg increase ~1.5X, new atm. Hg or liberation from oxidized sediments • No detectable changes in pH, dissolved organic carbon (DOC), or total Hg (could have been a DOC quality shift)
Mesocosms used to test effects of sulfur, “new” mercury, and DOC on MeHg production and bioaccumulation •Hg isotopes added in increments of the average annual loading rate (22 ug/m2): 0.5x, 1.0x, 2.0x in successive annual experiments with differing isotopes •SO42- added to achieve both ends of the Goldilocks regime •DOC added to increase ambient levels by 50% and 100% using native Hydrophobic Organic Acids Hg (new), SO4, DOC MeHg spikedinto mesos Over 88 mesocosms at primary site
Surface Water Results Ambient MeHg Spike MeHg
Bioaccumulation results: Spike + DOC (net accumulated vs control) Spike only (net accumulated vs control)
Bioaccumulation results: SO4 only (net accumulated vs control) Spike + SO4 (net accumulated vs control)
Fxn: external Hg, SO4 and DOC accelerated Methylation and Release of new Hg, & SO4 (internal) rewet relaxation dry down Everglades MeHg Cycle
Summary: MeHg and Restoration • MeHg production in the Everglades is a function of small scale processes that are driven by large scale land-use and air-emission practices. • Ecosystem-scale and baseline-level MeHg distributions are driven by external driving factors of sulfate and DOC. • Strong spring time MeHg pulses are driven by natural and unnatural dry-down and rewet periods • Mesocosm results show that Hg, SO4, and DOC additions all lead to new MeHg production • 0.5-2 year doses of Hg are undetectable in food webs 1 year after dosing.
Summary continued: • DOC and SO4 are equally efficient at producing new MeHg…however, DOC additions appeared to inhibit bioaccumulation of the new MeHg • Ecosystem scale changes in SO4 and DOC flows related to recent flow rerouting have lead to substantial changes in MeHg at long-term study sites. • Godilocks picked up and left, but where did she move? How will restoration impact magnitude and distribution of MeHg in the ecosystem?
Acknowledgements: Funding provided by: The USGS Priority Ecosystems Program USEPA STAR Program Florida DEP Additional logistical support from: