Download
1 / 21
210 likes | 352 Views
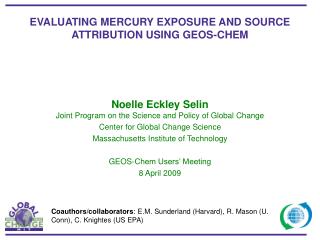
Building a Global Modeling Capability for Mercury with GEOS-CHEM. Noelle Eckley Selin EPS Day 12 March 2005. THE MERCURY CYCLE: CURRENT. ATMOSPHERE 5000. Anthropogenic Emissions 2400. Wet & Dry Deposition 2600. Land emissions 1600. Net Wet & Dry Deposition 1900. Net Oceanic

E N D
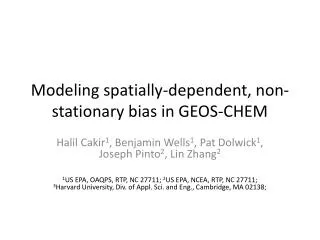
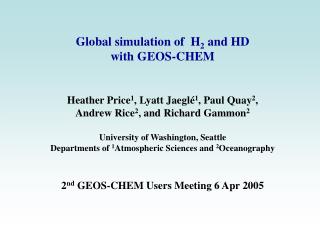
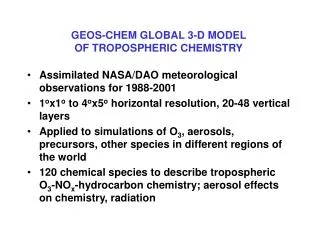
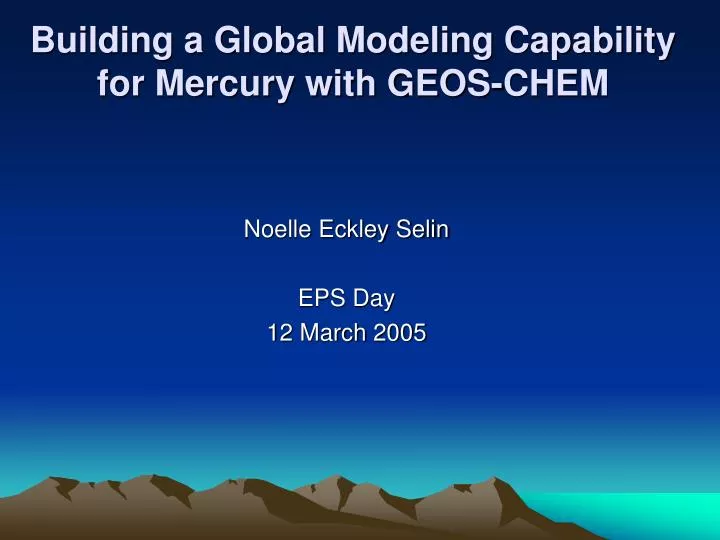
Building a Global Modeling Capability for Mercury with GEOS-CHEM Noelle Eckley Selin EPS Day 12 March 2005
THE MERCURY CYCLE: CURRENT ATMOSPHERE 5000 Anthropogenic Emissions 2400 Wet & Dry Deposition 2600 Land emissions 1600 Net Wet & Dry Deposition 1900 Net Oceanic Evasion 1500 (1680-3120) (1800-3600) (700-3500) (1300-2600) (700-3500) SURFACE SOILS 1,000,000 OCEAN 289,000 River 200 Extraction from deep reservoirs 2400 (1680-3120) Quantities in Mg/year Uncertainty ranges in parentheses Adapted from Mason & Sheu, 2002 Net burial 200
k=8.7(+/-2.8) x 10-14 cm3 s-1 (Sommar et al. 2001) k=9.0(+/-1.3) x 10-14 cm3 s-1(Pal & Ariya 2004) OH Hg0 1.7 ng/m3 Gaseous Phase Hg2+ 10-200 pg/m3 Oxidation O3 k=3(+/-2) x 10-20 cm3 s-1 (Hall 1995) Reported rate constants up to k=1.7 x 10⁻¹⁸cm3 s-1 Henry’s Constant 0.11 M/atm Henry’s Constant 1.4x10⁶ M/atm Oxidation Hg0 Aqueous Phase ? Hg2+ Oxalate? SO3 HO2 Reduction • k=1.1-1.7 x 10⁴ M-1 s-1 (Pehkonen & Lin 1998) • Shouldn’t occur (Gårdfeldt & Jonsson 2003) • k=0.0106 (+/- 0.0009) s-1 (vanLoon et al. 2000) • Occurs only where high sulfur, low chlorine Particulate Phase HgP 1-100 pg/m3
What does this mean for global modeling? • Use observations from latitudinal gradient, seasonal cycles, and short-term variability to constrain uncertainties • Potential for application of inverse modeling? (Chris Holmes…) • GEOS-CHEM simulation • Oxidation reactions: “best guess” from the published literature • Aqueous reduction: photochemically mediated, fixed reaction rate, proportional to [OH](g)
MERCURY BUDGET IN GEOS-CHEM ATMOSPHERE τ = 0.77 yr τ = 3.5 days τ = 7 days Net ox: 5489 Via OH:10236 Hg0 4260 Hg(P) 2 Hg(II) (trop.) 280 k=8.7 x 10⁻¹⁴ cm3 s-1 Via O3: 2377 k=3 x 10-20 cm3 s-1 Reduction 7124 2000 1500 775 1446 204 Land Re-emissions Ocean Emissions 1041 191 Anthropogenic Emissions 500 Dry Deposition 11 5327 Wet Deposition Land (Natural) Emissions Wet Deposition Inventories in Mg Rates in Mg/yr Dry Deposition
TGM: Model vs. Measurements + Continental sources in South America? Cruise data in the Pacific – inconsistent with Okinawa Underestimate of concentrations over the oceans
Comparing Model with Measurements: Hemispheric Average TGM • Ratio of NH/SH in measurements: 1.49 +/- 0.12 (Temme et al. 2003) • Northern hemisphere average measurement ≈ 1.7 ng/m3 • Northern hemisphere average GEOS-CHEM: 1.62 ng/m3 • Ratio of NH/SH in GEOS-CHEM simulation: 1.5 • Shows that Hg lifetime in GEOS-CHEM is realistic Temme et al. 2003: black dots GEOS-CHEM: red line
Vertical Profiles of Mercury GEOS-CHEM:Vertical profile over Ontario Banic et al. 2003: aircraft measurements of Hg0 over Ontario GEOS-CHEM: Latitudinal average Hg0
Hg(II) in the stratosphere? Supported by preliminary aircraft Measurements…
Wet Deposition: Model vs. Measurements High Hg deposition in tropical regions; Gradient with latitude Overestimate of deposition: Too much Hg(II)
Future plans for GEOS-CHEM Hg simulation • Land and ocean re-emission parameterization: tracing emissions from source to receptor Source tag maintained through deposition and reemission process Emissions “tagged” by source and region Chemistry and Deposition Reemission Deposition “tagged” by source and region Source Region Receptor Region Land or Ocean Surface Ocean emissions model: collaboration with Sarah Strode, Lyatt Jaegle @ Univ. of Washington
Re-emission Modeling in GEOS-CHEM Wet and Dry Deposition Emissions Emissions Historical Deposition Lifetime of “new mercury: weeks to months “Old Mercury” soil concentrations initialized based on historical deposition patterns of natural, anthropogenic sources New Mercury Lifetime of “old mercury”: about 1000 yrs Old Mercury 920,000 preindustrial 80,000 postindustrial Quantities in Mg
Future Plans: “Mercury Depletion Events” (MDEs) in the Arctic • Episodic depletion of TGM at polar sunrise • Correlates with Arctic O3 depletion events • Mechanism: conversion to Hg(II) and subsequent deposition • Proposed mechanism: reaction with BrO? AMAP, 2003
Changing Contaminant Pathways Incoming solar radiation Precipitation (Rain/Snow) Air transport patterns Ice Cover and gas exchange AMAP, 2003
Collaborators/Acknowledgments • Advisor: Prof. Daniel Jacob • Rokjin Park • Sarah Strode & Lyatt Jaegle @ Univ. of Washington • Chris Holmes • Bob Yantosca
Anthropogenic Sources Source: Pacyna and Pacyna, 2002
Historical Record of Mercury from Ice Core • Pre-industrial concentrations indicate natural source • Episodic volcanic input • Mining emerges • Industrialization, and recent decrease Source: USGS
New vs. Old Mercury Source: Hintelmann et al. 2002