Download
1 / 26
290 likes | 492 Views
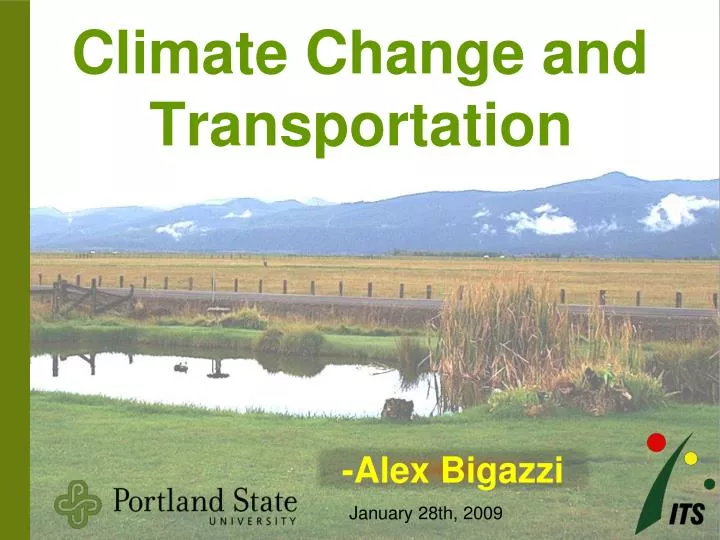
Climate Change and Transportation. -Alex Bigazzi. January 28th, 2009. The earth is warming. . Beyond levels of historic global temperature cycles Scientifically supported by many varied data sources. Human activities are changing the climate.

E N D
Climate Change and Transportation -Alex Bigazzi January 28th, 2009
The earth is warming. • Beyond levels of historic global temperature cycles • Scientifically supported by many varied data sources
Human activities are changing the climate. • Through greenhouse gases, aerosols, soot, and deforestation/land use changes • Even the former president acknowledged this.
Climate change is real and bad and caused by greenhouse gases. • This is our starting point. • “Climate Change” not “Global Warming” because of various regional effects
Greenhouse Gases Methane = 23 CO2 Eq. N2O = 296 CO2 Eq. Source: Inventory of U.S. Greenhouse Gas Emissions and Sinks: 1990-2006, USEPA #430-R-08-005
GHG Sources Fossil Fuel Combustion, Iron and Steel Production, Cement Manufacture, Municipal Solid Waste Combustion, Lime Manufacture, Ammonia Manufacture, Aluminum Production, Petrochemical Production, Titanium Dioxide Production, Landfills, Coal Mining, Manure Management, Wastewater Treatment… Source: Governor’s Advisory Group on Global Warming, Oregon Strategy for Greenhouse Gas Reduction, 2008
Energy Fuels Source: Inventory of U.S. Greenhouse Gas Emissions and Sinks: 1990-2006, USEPA #430-R-08-005
Where they come from Source: Inventory of U.S. Greenhouse Gas Emissions and Sinks: 1990-2006, USEPA #430-R-08-005
Where they go Reference: Inventory of U.S. Greenhouse Gas Emissions and Sinks: 1990-2006, USEPA #430-R-08-005
Transportation’s GHG Reference: Inventory of U.S. Greenhouse Gas Emissions and Sinks: 1990-2006, USEPA #430-R-08-005
We have a lot of cars… Source: 2007 Portland Metropolitan Region Transportation System Performance Report, Portland State University
…and we drive them a lot. Source: 2007 Portland Metropolitan Region Transportation System Performance Report, Portland State University
Especially during the peak periods. Source: 2007 Portland Metropolitan Region Transportation System Performance Report, Portland State University
We want power… Slide credit: Dr. Robert Bertini, Fuel for Thought
…and big cars. Source: Inventory of U.S. Greenhouse Gas Emissions and Sinks: 1990-2006, USEPA #430-R-08-005
Which (partly) explains… Climate-Change Policy and CO2 Emissions from Passenger Vehicles, Congressional Budget Office, October 2008
Car Fuel Economy Turnover Rate? * Estimate depends on carbon intensity of hydrogen and electricity sources Source: Bandivadekar et. al. (2008)
Raise gas prices? • Shown to: • Reduce VMT • Moderate Speeds • Reduce Car Sizes • But… • Increased CAFÉ standards will have a much bigger effect on fuel economy (CBO brief) • More research needed on elasticity of demand to gas prices Source: 2007 Portland Metropolitan Region Transportation System Performance Report, Portland State University
Impacts of Climate Change • Operations • Evacuations • Flood closure • Airport delays • NW Passage? Increasing . . . • Infrastructure • Flooding • Erosion • Thermal deformation • Stability • Bridge clearance
Opportunities • New administration • Congressional activity on reducing GHG • New surface transportation act in 2009 • Copenhagen int’l meeting to renew Kyoto (Dec. 09) • Green is in (look at advertising) • Indirectly a nat’l security issue (energy indep.) • We need new research, policies, and designs (this means you!)
Resources • EPA – www.epa.gov/climatechange/ • TRB – http://tris.trb.org/climatechange/ • OR – http://www.oregon.gov/ENERGY/GBLWRM/docs/GWReport-FInal.pdf • Portland Metropolitan Region Transportation System Performance Report – ITS Lab www.its.pdx.edu Acknowledgments • Dr. Robert Bertini, PSU • Dr. William York and the Academically-Controlled Auxiliary Activities Committee, PSU • AAA application form: http://aaa.groups.pdx.edu/
Estimating CO2 I-5 MP 302.5 (1.4 mile section) ?