Download
1 / 28
280 likes | 398 Views
Long-term water quality data and biogeochemical filtering along the Upper Clark Fork River, MT, USA. H . Maurice Valett 1 Marc Peipoch 1 Mike DeGrandpre 2 Vicki Watson 3 Mike Suplee 3,4 Rob Payn 5 1 Div. of Biological Sciences, University of Montana

E N D
Long-term water quality data and biogeochemical filtering along the Upper Clark Fork River, MT, USA. H. Maurice Valett1 Marc Peipoch1 Mike DeGrandpre2 Vicki Watson3 Mike Suplee3,4 Rob Payn5 1Div. of Biological Sciences, University of Montana 2Dept. of Chemistry and Biochemistry, University of Montana 3Environmental Sciences Program, University of Montana 4Montana Dept. of Environmental Quality, Helena, MT 5Dept. of Land Resources and Environmental Science, Montana State University
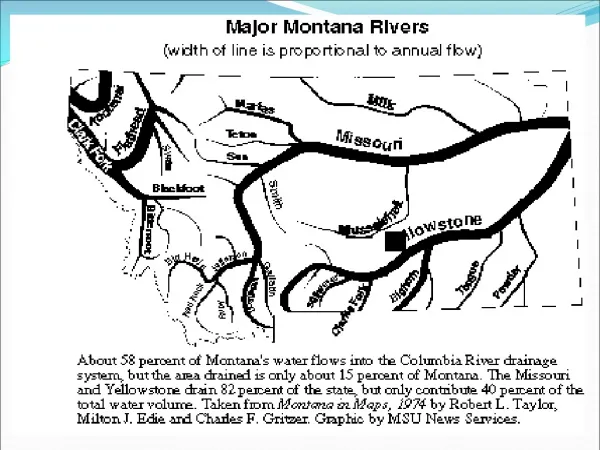
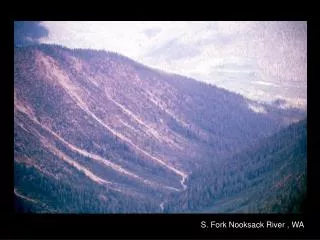
The Clark Fork River, MT - largest river by volume in Montana - Class I river for recreation from Warm Springs Cr. to the Idaho border
The Clark Fork/Milltown Superfund /Silver Bow (megafund) Site 1 4 2 3
Upper Clark Fork River OU Milltown Dam OU Reach C Reach B Reach A
Voluntary Nutrient Reduction Program (VNRP) sites: Clark Fork River from Butte to Lake Pend Oreille
Nutrients in the Upper Clark Fork River How have river nutrient conditions changed over the past 30 years? How can monitoring records be used to understand current biogeochemical functioning of the UCFR? How will nutrient conditions influence ecological restoration of lotic biota and processes?
USGS Flow Gauges Along the UCFR Missoula Anaconda Butte
Voluntary Nutrient Reduction Program (VNRP) sites Missoula 13 12 11 10 River Q: 1984 – 2014 Water chem (N & P): Period I: 1986-1992 Period II: 1999-2001 Period III: 2005 9 7 Anaconda Butte
1998-2004 400 UCFR – spatial and temporal trends in N and P Algal Chla (mg/m2) 2005-2009 200 Water quality criteria relate to nutrient concentrations. 0 450 Total N (μg/L) 300 150 0 60 Total P (μg/L) 30 0 …its what biota ‘see’. Site 9 Site 10 Site 12 But, what causes change? Site 15.5 Modified from Suplee et al. (2012)
UCFR Discharge Record (1984-2013): a gaining river system Turah (13) Gold Cr (12) Drummond (11) Garrison (10) Deer Ldg (9) +ΔQ with downstream progression Galen (7)
Nutrient Flux (F) and Load (L): discharge (vol/time) • Q flux (mass/time) concentration (mass/vol) • T load (mass) time (time) flux (mass/time)
Total N flux : 1986 – 1992 (7 years) UCFR TN flux increases with distance downstream (Mg/month)
Total P flux : 1986 – 1992 (7 years) UCFR TP flux increases with distance downstream (Mg/month)
Soluble Reactive P flux : 1986 – 1992 (7 years) UCFR SRP flux increases with distance downstream (Mg/month)
Nitrate flux : 1986 – 1992 (7 years) UCFR nitrate flux varies with distance downstream Most of the increase happens at the head of the continuum… especially during winter. (Mg/month)
Nitrate flux : 1986 – 1992 (years) In some places nitrate flux decreases with distance downstream (Mg/month)
Voluntary Nutrient Reduction Program (VNRP) sites WSTPs Missoula 13 Turah 12 Little Blackfoot River Bonita 11 Gold Creek 10 Garrison 9 Deer Lodge Warm Springs 7 Anaconda Butte
Nitrate flux : 1999 – 2001 (3 years) UCFR nitrate flux decreases in the same locations and with patterns similar to 10 years earlier (Mg/month)
Total N flux : 1999 – 2001 (3 years) UCFR TN flux increases with distance downstream with patterns similar to 10 years earlier (Mg/month)
Nitrate flux : 2005 (1 year) UCFR nitrate flux decreases in the same locations and with patterns similar to 10 years earlier (Mg/month)
Riverine hotspot for NO3- removal: variation in space and time 1986-1992 1999-2001 2005 Biota! (Mg/month) 9 10 12 7
1998-2004 400 Algal Chla (mg/m2) 2005-2009 Water quality criteria relate to Total N and Total P. Act as reservoirs for more bioavailable forms. 200 0 450 Total N (μg/L) 300 150 0 60 Total P (μg/L) 30 But what is it that what biota ‘see’? 0 Site 9 Site 10 Site 12 Site 15.5 Modified from Suplee et al. (2012)
Relative abundance of inorganic (i.e., reactive) N and P change seasonally Atomic N:P where: N = DIN = NO2- + NO3- + NH4+ P = orthophosphate
J F M A M J J A S O N D Relative abundance of inorganic (i.e., reactive) N and P change seasonally 30 Warm Springs (7) 20 10 0 300 Deer Lodge (9) 200 Atomic N:P 100 0 80 Gold Creek (11) 40 0 Winter: P-limitation Summer: N-limitation
green algae (Cladophora) - nutrient-rich - high N concentrations
bluegreen algae (bacteria) - P-rich - low N concentrations Nostoc N N Nostoc
Conclusions • Declining concentrations – evidence of management success • Seasonal variation in river N and P flux = differential connections • Declining N03-N flux = biological self-purification? • algal uptake vs. denitrification • Role of biological N-fixation • Floodplain restoration and influences on C, N, and P dynamics
Current monitoring along the UCFR MT DEQ maintains monitoring of water quality in the UCFR at a reduced number of sites from June to September …concomitant monitoring of benthic algal standing crops (Vicki Watson, UM, MT DEQ)