Download
1 / 13
140 likes | 153 Views
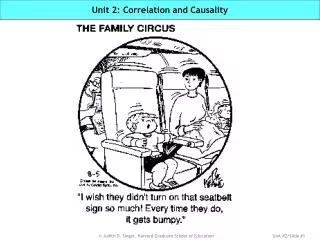
Lecture 2 Correlation. Correlation: Strength of association No manipulation. BUT..CANNOT INFER CAUSALITY BECAUSE YOU DID NOT MANIPULATE THE IV. But…. ice cream sales and murders highly correlated. Churches and Bars highly correlated. Correlational Research Analyze Data.

E N D
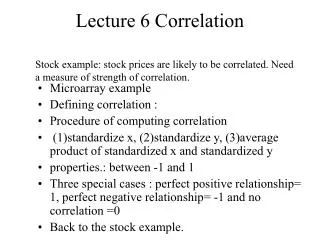
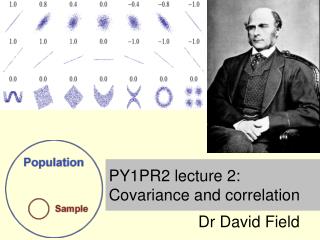
Lecture 2 Correlation
Correlation: Strength of association No manipulation BUT..CANNOT INFER CAUSALITY BECAUSE YOU DID NOT MANIPULATE THE IV But…. ice cream sales and murders highly correlated Churches and Bars highly correlated
Correlational Research Analyze Data Measure an index of the degree of the relationship One ordinal, one at least ordinal Both at least interval scale Spearman rank-order correlation Pearson product-moment correlation coefficient Degree of linear relationship Correlation coefficients: -1.00 to 1.00
Scatter plots: • - similar to line graphs (horizontal and vertical axes, x & y axis) • scatter plots show how much one variable is affected by another • the relationship between two variables is called their correlation • - usually consist of a large body of data points (pairs of scores)
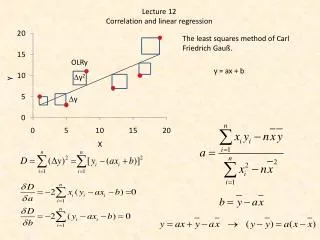
Extension of Descriptive Statistics Correlation: measures the relationship between 2 variables Correlation coefficient (r) strength (# value) & direction (+ or -) Pearson Product-Moment Coefficient A number between –1 & 1 Describes the relationship btwn pairs of variables Drinking & Accidents Study time & Party time r = -1.00 r = 1.00 Perfect positive correlation Perfect negative correlation
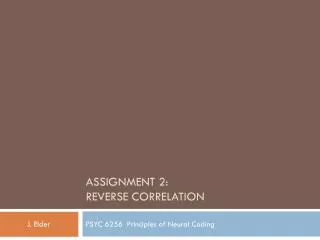
Coefficient of determination = r 2 Measure of the amount of variance shared by the two variables How much variability in one score can be explained by the variability in the other score , so… r =.60 r2 = .36 36% of the variation in school performance can be accounted for by the variation in intelligence 36% of the change in one variable can account for the change in the other variable
Correlational Research Precautions when measuring variables: Measurement Reactivity Participant Any effect on the participant’s behavior that is a result of the participant knowing he/she is being observed or measured – participant believes he/she knows what response is expected • filler items: insert questions that are irrelevant • to focus of study • use measures beyond the control of the participant • Ex. Instead of an anxiety scale…measure physiological activity
Your proposal… • Correlational Research (limitations) • Precautions when measuring variables: • (pairs of data) • Researcher influencing the participant • Never allow the same person to collect • both measures on the participant • 2. Never allow the researcher to know the • participant’s score on the first measure until • after the second measure has been taken Experimenter expectancy Experimenter reactivity
Your proposal… Correlational Research Precautions when measuring variables Confounding variables: extraneous variable systematically changes along with the variable of interest – don’t know if relationship is due to our variable of interest.. Ex: men that are more attractive are better liked: what if more men in this study dressed better too …are they more likable because of the are more attractive?
Correlation Problem r = degree to which X & Y vary together degree to which X & Y vary separately Degrees of freedom (df): n-1 Pearson r: df=n-2 (n=pairs) Tends to underestimate population variability
Results Section – APA • Summarizes the results of statistical testing • Tells the reader what was found without • interpretation (this is in discussion)…numbers!!! • Standard order of reporting stats: • Statistic, df, statistic value, p value • All non-Greek single letters=italics • 1st: state the most important finding first • then so on • Don’t report unless significant!!!
Results Section – APA • Formula…can’t go wrong!!!! • First begin the sentence with the type of test • that was conducted then, • what the test was conducted on… • always the DV it will always be the data…then • the groups…if appropriate…if correlation it will be • the two variables… • then tell the reader what was found… • significant • need to report descriptive statistics…either in text • or in a figure This is not the place to get long-winded