Download
1 / 4
50 likes | 178 Views
INTERMEDIATE ONE GRAPHS, CHARTS, TABLES Ex1 I1U2O4 Bar Graph. Describe the trend in each of these line graphs:. Rising (b) Falling (c) Slow rise. 2. This line graph shows the average number of phone calls made from Scara Island over a certain period of time in a normal day.5

E N D
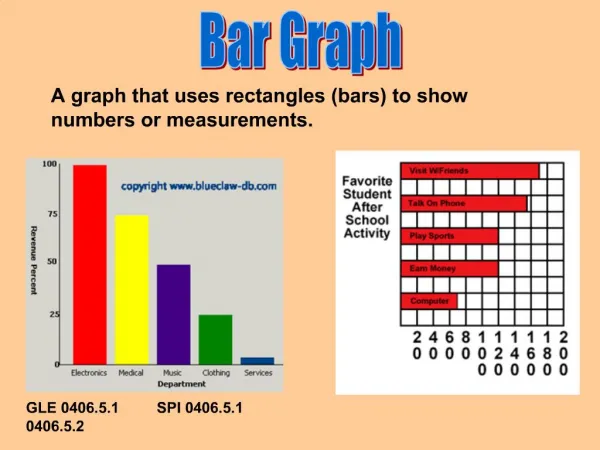
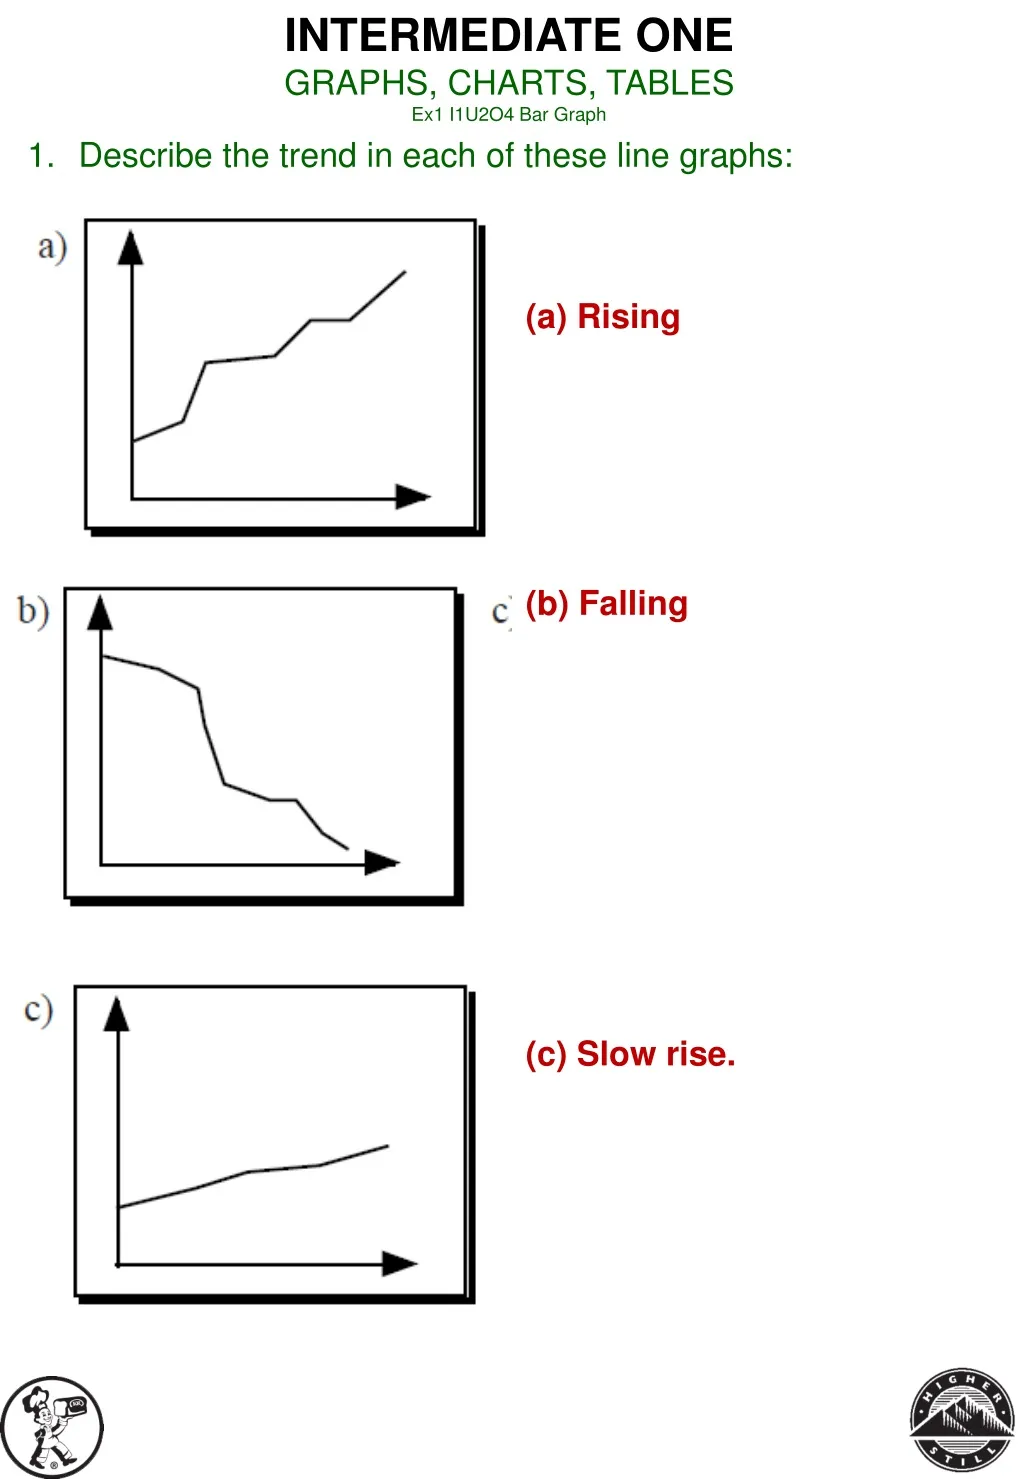
INTERMEDIATE ONE GRAPHS, CHARTS, TABLES Ex1 I1U2O4 Bar Graph • Describe the trend in each of these line graphs: • Rising • (b) Falling • (c) Slow rise.
2. This line graph shows the average number of phone calls made from Scara • Island over a certain • period of time in • a normal day.5 • What is the peak time for calls? (Give a reason.) • (b) Why is there an increase in the number of calls after 6 p.m.? • (c) Describe the trend of the graph over the period. • 3. Janice visits her gran every Sunday. She goes by car. • This graph, shows one such journey. • (a) When did Janice leave home? • (b) When did she get home? • (c) Roughly how far away from Janice does her gran stay? • (d) Describe what might have happened round about quarter past ten. • (e) How long did she stay at her gran’s? • 10 a.m. • (b) Cheaper rate • (c) Before 10 - high, then fall to noon, slight rise at lunch, then fall away till 6p.m. - quite a rise till 8 p.m. then as day ends, trend falls. • 1000 ( • b) 1215 • (c) 30 miles • (d) Flat tyre?? • (e) 30 mins. Approx.
4. These pie charts give some indication of the changes in methods of transport over the past 40 years. Describe in detail the major changes. Giving reasons for your answers. Decrease in use of train - bus about same - increase in car & plane More people have cars and more confidence in air travel.
5. A modern two-tier fish tank is filled with water from a tap at a steady rate. One of the graphs below indicates the change in the height of the water as the tank fills. Which graph is it? ..... and give a reason for your choice. Graph 4. Fills steadily, but quickly - then fills steadily, but slower.