Download
1 / 34
370 likes | 619 Views
Misinterpreting X-Ray Diffraction Results by Tom and Keith. X-ray. How many of you have carried out x-ray diffraction? How many of you have interpreted x-ray diffraction results? Who is responsible for Bragg’s Law?. Example 1. Rock Salt. 200. 220. 111. 222. 311. Why are peaks missing?.

E N D
X-ray • How many of you have carried out x-ray diffraction? • How many of you have interpreted x-ray diffraction results? • Who is responsible for Bragg’s Law?
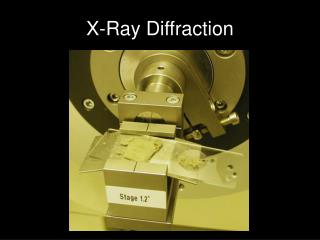
Example 1 Rock Salt
200 220 111 222 311 Why are peaks missing? JCPDF# 01-0994 • The sample is made from Morton’s Salt • JCPDF# 01-0994 is supposed to fit it (Sodium Chloride Halite)
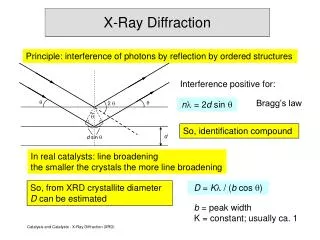
200 220 111 222 311 It’s a single crystal 2q The (200) planes would diffract at 31.82 °2q; however, they are not properly aligned to produce a diffraction peak The (222) planes are parallel to the (111) planes. At 27.42 °2q, Bragg’s law fulfilled for the (111) planes, producing a diffraction peak.
A random polycrystalline sample that contains thousands of crystallites should exhibit all possible diffraction peaks 200 220 111 222 311 2q 2q 2q • For every set of planes, there will be a small percentage of crystallites that are properly oriented to diffract (the plane perpendicular bisects the incident and diffracted beams). • Basic assumptions of powder diffraction are that for every set of planes there is an equal number of crystallites that will diffract and that there is a statistically relevant number of crystallites, not just one or two.
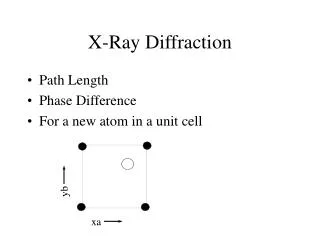
200 <100> 111 220 222 311 Powder Samples • Salt Sprinkled on double stick tape • What has Changed? NaCl Hint Typical Shape Of Crystals It’s the same sample sprinkled on double stick tape but after sliding a glass slide across the sample
Example 2 PZT
011 110 111 200 002 A Tetragonal PZT • Lattice Parameters • a=4.0215 Å • b=4.1100 Å Sample Re-polished and Re-measured What happened to cause the peaks to shift?
Disp A Tetragonal PZT • Lattice Parameters • a=4.0215 Å • c=4.1100 Å Change In Strain/Lattice Parameter? a=4.07A c=4.16A 101/110 002/200 111 Z-Displaced Fit Disp.=1.5mm
011 Disp 110 111 200 002 Z-Displacements • Tetragonal PZT • a=4.0215 • b=4.1100 R θ 2θ
Example 3 Nanocrystalline Materials
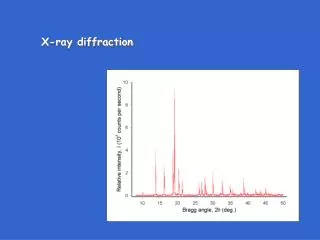
Intensity (a.u.) 66 67 68 69 70 71 72 73 74 2 q (deg.) Which of these diffraction patterns comes from a nanocrystalline material? Hint: Why are the intensities different? • These diffraction patterns were produced from the exact same sample • The apparent peak broadening is due solely to the instrumentation • 0.0015° slits vs. 1° slits
Crystallite Size Broadening • Peak Width B(2q) varies inversely with crystallite size • The constant of proportionality, K (the Scherrer constant) depends on the how the width is determined, the shape of the crystal, and the size distribution • the most common values for K are 0.94 (for FWHM of spherical crystals with cubic symmetry), 0.89 (for integral breadth of spherical crystals with cubic symmetry, and 1 (because 0.94 and 0.89 both round up to 1). • K actually varies from 0.62 to 2.08 • For an excellent discussion of K, refer to JI Langford and AJC Wilson, “Scherrer after sixty years: A survey and some new results in the determination of crystallite size,” J. Appl. Cryst.11 (1978) p102-113. • Remember: • Instrument contributions must be subtracted
Intensity (a.u.) 46.7 46.8 46.9 47.0 47.1 47.2 47.3 47.4 47.5 47.6 47.7 47.8 47.9 2 q (deg.) Intensity (a.u.) 46.7 46.8 46.9 47.0 47.1 47.2 47.3 47.4 47.5 47.6 47.7 47.8 47.9 2 q (deg.) Methods used to Define Peak Width • Full Width at Half Maximum (FWHM) • the width of the diffraction peak, in radians, at a height half-way between background and the peak maximum • Integral Breadth • the total area under the peak divided by the peak height • the width of a rectangle having the same area and the same height as the peak • requires very careful evaluation of the tails of the peak and the background FWHM
Williamson-Hull Plot y-intercept slope Grain size and strain broadening Grain size broadening K≈0.94 Gausian Peak Shape Assumed
Dealing With Different Integral Breadth/FWHM Contributions Contributions Lorentzian and Gaussian Peak shapes are treated differently B=FWHM or β in these equations Williamson-Hall plots are constructed from for both the Lorentzian and Gaussian peak widths. The crystallite size is extracted from the Lorentzian W-H plot and the strain is taken to be a combination of the Lorentzian and Gaussian strain terms. Lorentzian (Cauchy) Gaussian Integral Breadth (PV)
Example 4 Crystal Structure vs. Chemistry
Two Perovskite Samples Assuming that they are both random powder samples what is the likely cause? • What are the differences? • Peak intensity • d-spacing • Peak intensities can be strongly affected by changes in electron density due to the substitution of atoms with large differences in Z, like Ca for Sr. SrTiO3 and CaTiO3 200 210 211 2θ (Deg.)
Intensity(Counts) 45 50 55 60 65 2θ (Deg) Two samples of Yttria stabilized Zirconia Why might the two patterns differ? • Substitutional Doping can change bond distances, reflected by a change in unit cell lattice parameters • The change in peak intensity due to substitution of atoms with similar Z is much more subtle and may be insignificant 10% Y in ZrO2 50% Y in ZrO2
ZrO2 46nm CeO2 19 nm CexZr1-xO2 0<x<1 Intensity (a.u.) 45 46 47 48 49 50 51 52 2 q (deg.) Polycrystalline films on Silicon Why do the peaks broaden toward each other? • Solid Solution Inhomogeneity • Variation in the composition of a solid solution can create a distribution of d-spacing for a crystallographic plane
Example 5 Radiation from a copper source - Is that enough information? “Professor my peaks split!”
113 Kα1 Kα2 006 Why does this sample second set of peaks at higher 2θ values? • Hints: • It’s Alumina • Cu source • Detector has a single channel analyzer
Diffraction Pattern Collected Where A Ni Filter Is Used To Remove Kβ Ka1 Ka2 What could this be? W La1 Due to tungsten contamination Kb
Wavelengths for X-Radiation are Sometimes Updated • Often quoted values from Cullity (1956) and Bearden, Rev. Mod. Phys. 39 (1967) are incorrect. • Values from Bearden (1967) are reprinted in international Tables for X-Ray Crystallography and most XRD textbooks. • Most recent values are from Hölzer et al. Phys. Rev. A56 (1997) • Has your XRD analysis software been updated?
Example 6Unexpected Results From An Obviously Crystalline Sample
Unexpected Results From an Unknown Sample D8 Focus • No peaks seen in a locked coupled 2θ scan of a crystalline material Why?
Bruker Diffractometer with Area Detector α α = 35° 2θ=50° ω=25 ° Detector distance= 15 cm
JCPDF 75-0097 After Crushing The Unknown Sample D8 Focus We now have two visible peaks that index with CaF
2D (Area) Diffraction allows us to image complete or incomplete (spotty) Debye diffraction rings Polycrystalline thin film on a single crystal substrate Mixture of fine and coarse grains in a metallic alloy Conventional linear diffraction patterns can easily miss information about single crystal or coarse grained materials
Match The Sample/Measurement Conditions With The Diffraction Pattern 1 2 3