Download
1 / 64
650 likes | 827 Views
The New NSSL - MDL Partnership:. New Multiple- Radar/Sensor Application R&D for Warning Decision Making. Gregory J. Stumpf. CIMMS / University of Oklahoma NWS Meteorological Development Laboratory Decision Assistance Branch Location : National Severe Storms Laboratory, Norman, OK.

E N D
The New NSSL - MDL Partnership: New Multiple- Radar/Sensor Application R&D for Warning Decision Making Gregory J. Stumpf CIMMS / University of Oklahoma NWS Meteorological Development Laboratory Decision Assistance Branch Location: National Severe Storms Laboratory, Norman, OK
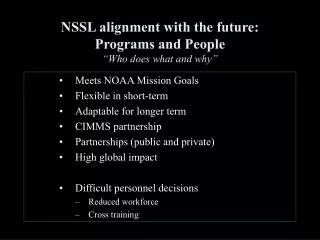
NSSL’s Vision in 2003 for NWS Warning Improvement • Support NWS Science and Technology Infusion Plan • NSSL pitching idea to NWS to make WDSSII a Multi-Sensor Products Generator for AWIPS (to supplement ORPG) • ORPG only produces single-radar products • Warning test beds (at least one per region) using WDSSII to feed products to AWIPS • Introduce 4D radar analysis concepts as an AWIPS “pop-up” option • NWS Warning Decision Making “team” interaction; training • Motivate WDM team to aid with the design phase of new warning applications and display concepts • Include WDSSII into WDTB Advanced Warning Operations Course as a high-resolution 4D radar base-data analysis tool
The First Step • My NSSL position was moved into the NWS Meteorological Development Laboratory Decision Assistance Branch • My new boss: Dr. Stephan Smith • My location remained at NSSL in Norman • Act as a liaison between severe weather research and application development at NSSL and NWS warning operations program • Develop AWIPS testbed for new remote-sensing technologies and new multiple-sensor warning applications
NSSL’s Mission • To enhance NOAA’s capabilities to provide accurate and timely forecasts and warnings of hazardous weather events. NSSL accomplishes this mission, in partnership with the National Weather Service (NWS), through • a balanced program of research to advance the understanding of weather processes • research to improve forecasting and warning techniques • development of operational applications • and transfer of understanding, techniques, and applications to the NWS. • NSSL is the sole NOAA agency responsible for the R&D of new applications and technology to improve NWS severe weather warning decision making.
Needs Assessment • More frequent algorithm updates (not at end of volume scan) • Intermediate products (help to understand final output, understand science, build expertise) • Better data QC (to remove false alarms outside storms) • Multi-radar integration (cones-of-silence, far ranges, terrain blockage) • NSE integration (automated, more frequent updates, better spatial resolution, for HDA, SCIT-RU, multi-radar integration).
The NWS Severe Weather Warning Challenge • How do operational warning forecasters distinguish between severe and non-severe, and tornadic and non-tornadic thunderstorms with the information they have?
The NWS Severe Weather Warning Challenge • To reduce the uncertainty and improve the accuracy of a prediction, a warning forecaster will integrate more information about a storm as viewed by other radars and other sensors: • Multiple radar data (WSR-88D, TDWR) • Near-Storm Environment (NSE) • Surface observations • Upper Air data • Lightning data • Satellite data • Algorithm guidance • Trends • Spotter reports • Statistical knowledge of past events • Basic understanding of storm physics
Severe Weather Warning Decision Making Applications • It makes sense that the NWS severe weather detection, diagnosis, and prediction tools also integrate multiple-sensor information! • “Multiple-sensor” integration is not a new concept • However, the MS concept has yet to be fully realized within NWS warning applications (still mostly single-radar based)
New Severe Weather Algorithm Requirements • Objectives for new warning application development: • Integrate multiple-radar and multiple-sensor information • No longer single-radar specific • Must input highest resolution data in native format • More accuracy in detection and diagnosis (oversampling - more “eyes” looking at storms). • Must have rapid-update capability • Uses virtual volume scan concept • Better lead time (no more waiting until end of volume scan for guidance). • Must be scientifically sound
Legacy WSR-88D Severe Weather Applications • ORPG Algorithms: SCIT, HDA, TDA, MDA, etc. • Signature detection based on single-radar data. • Disadvantages of single-radar algorithms: • Products generated at end of volume scan • Only 5-6 minute updates – storm evolution is fast • Poor sampling within cone-of-silence and at far ranges • Products all keyed to individual radar volume scan and radar domain (azimuth/range/elevation) • No automated tuning for different near-storm environments
VIL = 34 KJAN VIL = 52 KLIX VIL = 45 KMOB Many single radars provide many different answers
VIL = 52 KLIX Many single radars provide many different answers The “best” detection?
Multiple Radar Algorithms • Storms are oversampled, especially in cones-of-silence and at far ranges from single radars. • Outputs information in rapid intervals; can be as fast as individual elevation scan updates using “virtual volume scans”. • “Rapid update” also works in single-radar mode if coverage or outages dictate. • Multiple radars and rapid update lead to more stable tracks and trends • Products keyed to 4D earth-relative coordinate system (lat, lon, elevation, time). • Designed to be VCP independent, and can be integrated with other “gap-filling” radar platforms (TDWR, ASR, PAR, SMART-R, NETRAD/CASA, foreign radars, commercial radars).
KJAN KLIX KMOB Multiple radars provide one answer
3D Multiple-radar grid applications • Mosaic multiple radar data to create a 3D Cartesian lat/lon/ht grid. • Uses time-weighting and power-density (distance) weighting schemes. • Intelligently handles terrain blockage, interpolation in sparse grid cells • Can advect older data when running a motion estimator. • Run algorithms on continuously-updating 3D grids (“virtual volumes”) – the data are nearly LIVE: • 3D reflectivity field for MaxRef, VIL, echo top, LRM, LRA, hail, Cell ID • 3D velocity derivative fields for vortex (rotation) and wind shift (convergence) detection. • Easy to integrate other sensor information (NSE, satellite, lightning, etc.) on similar grids. • e.g., Thermodynamic info for hail diagnosis.
Multiple-Radar 3D Merging • 3D Grid information: • Create a 3D Lat-Lon-Height grid of 3D “voxels” • Current resolution: 0.01 x 0.01 x 1 km • Current domain: covers the entire CWAs of OUN, FTW, and TSA, plus a “buffer” • Radars: Level-II data from KTLX, KINX, KSRX, KVNX, KICT, KDDC, KAMA, KLBB, KFDR, KFWS, KDYX (later: KGRK, and even later: CONUS!) • Each 3D grid voxel “knows” which radars are sensing it (this info is cached) • If terrain blocks a radar’s view of a voxel, that radar is not used for that voxel • Latest elevation scan of data from any radar is used, replacing the previous version (“virtual volumes”).
Multiple-Radar 3D Merging • Data are QCed, to remove non-precipitation echoes (e.g., AP) • Older data are advected forward in time using a motion estimator • Data are interpolated between elevation scans • For each radar sensing a voxel, the radar info is weighted based on a power-density function (inversely proportional to distance). • Internal 3D grid is updating continuously, but new product grids are generated every 60 seconds (can be faster!).
Quality Control Neural Network (QCNN) • Use multiple-sensor information to segregate precipitation echoes from non-precipitation echoes: • Non-precipitating clear-air return • Ground Clutter • Anomalous Propagation (AP) • Chaff • Multiple Sensor Information (two stages): • Radar (texture statistics from all three moments, vertical profiles) • Radar, satellite, and surface temperature (“cloud cover”) • Resulting clean “precipitation” field used as input to other applications (MDA, TDA, QPE, LLSD) • MDA and TDA false alarms are going to be a major issue when radars sample clear air return with more resolution (new VCPs, TDWR).
Quality Control Neural Network (QCNN) • Uses all three radar moments, and IR satellite and surface data to estimate cloud cover Original dBZ
Quality Control Neural Network (QCNN) • Uses all three radar moments, and IR satellite and surface data to estimate cloud cover Radar-only QCNN
Quality Control Neural Network (QCNN) • Uses all three radar moments, and IR satellite and surface data to estimate cloud cover Cloud Cover (Tsfc – Tsat)
Quality Control Neural Network (QCNN) • Uses all three radar moments, and IR satellite and surface data to estimate cloud cover Multiple- sensor QCNN Kept precip cells Removed remaining Non-precip returns
Quality Control Neural Network (QCNN) Original dBZ
Quality Control Neural Network (QCNN) Quality Control Neural Network (QCNN)
Multi-Scale Storm Segmentation • A novel method of performing multi-scale segmentation of image data (e.g., radar reflectivity) using statistical properties within the image data itself. • The method utilizes a K-Means clustering of texture vectors computed within the image; clusters are hierarchical. • Uses, besides the actual values on the image grid, the distribution of values around each grid point.
2D Motion Estimation • Uses K-means texture segmentation to extract multiple-scale components • Advects multiple-scale textures • Growth and Decay component • Can track and trend individual multiple-scale textures • 2D motion field (u, v) used to advect older data in 3D dBZ grid. • This is a 60-minute loop • 30-min actual data • 30-min forecast
Multiple-Radar 3D Reflectivity Mosaic Continuously- Updating Grid
Multiple-Radar 3D Reflectivity Mosaic 01:20Z - 01:30Z, 2002-08-14 Continuously- Updating Grid cross section
Multiple-Radar 3D Reflectivity Mosaic Continuously- Updating Grid
Multiple-Radar 3D Reflectivity Mosaic • Proposed CONUS Testbed
Multiple-Radar 3D Reflectivity Mosaic • Filling the cones-of-silence • Single Radar
Multiple-Radar 3D Reflectivity Mosaic • Filling the cones-of-silence • Multiple radars
Single Radar Cell ID • VIL "hole" as the storm goes through the cone-of-silence. Cone-Of-Silence Single Radar: KINX
Increased Lead Time: 83 minutes Multiple Radar Cell ID • No VIL "hole" as the storm goes through the cone-of-silence. • The VIL maxxes out within the cone-of-silence. • The upward trend of max VIL is only observed by integrating multiple-radars. • Trend information is smoother (fewer sharp peaks and valleys) and is available at more rapid intervals (60 seconds versus 5 minutes). • The data are nearly “live”. • Cell tracking tends to be much more stable. • Time association techniques are employed every 60 seconds (more rapidly), instead of every 5-6 minutes (per volume scan) where there is a greater likelihood of storm evolution and storm centroid "jumping". Single Radar: KINX Multi-Radar: KINX, KICT, KSGF, KSRX, KTLX
New Tools for Hail Diagnosis Using Conventional Radar • Taking the concept of cell-based HDA to a grid • Integrate multi-radar and NSE information • Provide intermediate products • Provide other “popular” hail-diagnosis products
Plot of hail kinetic energy flux (used to calculate SHI; solid curve), and liquid water content (used to calculate VIL; dashed curve), as a function of reflectivity. VIL versus SHI • Both use “vertically integrated dBZ” • dBZ profiles can come from • A Storm cell • A 3D grid (integrate hold (lat, lon) constant • A 3D grid (integrate along a tilt) • VIL integrates the entire profile, and caps dBZs at 56 to remove ice contamination • Severe Hail Index (SHI) integrates only the profile above the melting layer, and excluded dBZ below 40, to include ice.
Severe Hail Index (SHI) • No reflectivities below 40 dBZ are used, all reflectivities above 50 dBZ are used, and reflectivities between 40 and 50 dBZ are linearly weighted from 0 to 1 (a proxy to the curve shown in Fig. 2). • Furthermore, only reflectivities (meeting the above criteria) above the melting layer are considered. Reflectivities between the 0C and -20C levels are weighted from 0 to 1, and all reflectivities (meeting the above criteria) above the -20C level are considered. • Temperature profile is made available from RUC 00h analysis grids. • Maximum Expected Size of Hail (MESH; inches) = 0.1 * (SHI)0.5
Cell versus Grid • dBZ profile from cell: • Pros: Follows max dBZ, inherent tilt • Cons: SCIT frequently misses detection of entire dBZ profile • dBZ profile from 3D grid: • Pros: There is always a complete dBZ profile, multiple-radar, motion estimation minimizes apparent tilt due to fast motion • Cons: Vertical integration may not capture storm tilt (BUT: we are working on this issue)
Tilted Storm Cores • Future: Tilted Integration VIL – Vertical Integration
Tilted Storm Cores • Future: Tilted Integration • Storm Cores projected to location of hail fall, not under echo overhangs • Cleaner image • Grid can replace cell-based value • Multi-radar SCIT and/or NSE can be used to develop 2D grid of expected storm tilt angle VIL – Tilted Integration
Cell versus Grid • Cell-based VIL or SHI: • Only one value per volume scan • Always at end of volume scan • Single-radar • NSE data is sparse, and must be manually-input • Multi-radar Grid based VIL or SHI: • Geospatial information: where in cell is largest hail falling? • Can accumulate grid over time for hail swaths • Much easier for event verification (know where to make the probing calls). • Storms are oversampled by multiple-radars, especially in cones-of-silence • Output is essentially live (rapid update).
Intermediate and Popular products • It’s nice to have the “final answer”, but what ingredients went into the gridded MESH? • dBZ relative to temperature altitudes • Reflectivity at 0C, Reflectivity at -20C • Height of 50 dBZ above -20C altitude • Echo tops of various dBZ thresholds • 50 dBZ Echo Top • Eliminates the arduous task of using all-tilts and data sampling, as well as mental multi-radar and NSE integration, to determine these values for each and every storm at every time • What values correspond to what hail sizes? You tell us!
Rapidly-Updating Gridded Products from 3D Mosaic • Shown: Maximum Expected Hail Size (MEHS) • “Virtual Volume” updates for each new elevation scan. • Integrates NSE thermodynamic data from model • 10-minute loop
Gridded Hail Products integrated with NSE data • Easier to integrate with thermodynamic data from mesoscale model grids. • Automated. • Better spatial and temporal resolution.
ExamplesMay 20, 2001 1 km MSL Reflectivity 50 dBZ Echo Top MESH Height of 50 dBZ Above -20C MESH 2hr Swath Reflectivity at 0C Reflectivity at -20C
Vortex Detection and Diagnosis (VDDA) • Linear-Least Squares Derivatives (LLSD) of velocity • Azimuthal and Radial Shear • Multi-radar mosaic of 0-4 km shear • Azimuthal Shear can be accumulated in time. LLSD Azimuthal Shear
Mesocyclone Convergence Vortex Detection and Diagnosis (VDDA) • Modeled Rankine Vortex (Northern Hemisphere) Radial Shear (LSD) Simulated WSR-88D Velocity Azimuthal Shear (LSD) CyclonicShear Divergence Anticyclonic Shear