Download
1 / 80
800 likes | 811 Views
This text covers different learning problems and algorithms, including supervised learning and classifiers such as decision trees, Naïve Bayes, and boosting. It discusses applications like face detection in images and presents decision boundaries for various classifiers and inductive learning concepts.

E N D
Machine Learning – Classifiers and Boosting Reading Ch 18.6-18.12, 20.1-20.3.2
Outline • Different types of learning problems • Different types of learning algorithms • Supervised learning • Decision trees • Naïve Bayes • Perceptrons, Multi-layer Neural Networks • Boosting • Applications: learning to detect faces in images
You will be expected to know • Classifiers: • Decision trees • K-nearest neighbors • Naïve Bayes • Perceptrons, Support vector Machines (SVMs), Neural Networks • Decision Boundaries for various classifiers • What can they represent conveniently? What not?
Inductive learning • Let x represent the input vector of attributes • xj is the jth component of the vector x • xj is the value of the jth attribute, j = 1,…d • Let f(x) represent the value of the target variable for x • The implicit mapping from x to f(x) is unknown to us • We just have training data pairs, D = {x, f(x)} available • We want to learn a mapping from x to f, i.e., h(x; q) is “close” to f(x) for all training data points x q are the parameters of our predictor h(..) • Examples: • h(x; q) = sign(w1x1 + w2x2+ w3) • hk(x) = (x1 OR x2) AND (x3 OR NOT(x4))
Decision Boundaries Decision Boundary Decision Region 1 Decision Region 2
Classification in Euclidean Space • A classifier is a partition of the space x into disjoint decision regions • Each region has a label attached • Regions with the same label need not be contiguous • For a new test point, find what decision region it is in, and predict the corresponding label • Decision boundaries = boundaries between decision regions • The “dual representation” of decision regions • We can characterize a classifier by the equations for its decision boundaries • Learning a classifier searching for the decision boundaries that optimize our objective function
Example: Decision Trees • When applied to real-valued attributes, decision trees produce “axis-parallel” linear decision boundaries • Each internal node is a binary threshold of the form xj > t ? converts each real-valued feature into a binary one requires evaluation of N-1 possible threshold locations for N data points, for each real-valued attribute, for each internal node
Decision Tree Example Debt Income
Decision Tree Example Debt Income > t1 ?? Income t1
Decision Tree Example Debt Income > t1 t2 Debt > t2 Income t1 ??
Decision Tree Example Debt Income > t1 t2 Debt > t2 Income t3 t1 Income > t3
Decision Tree Example Debt Income > t1 t2 Debt > t2 Income t3 t1 Income > t3 Note: tree boundaries are linear and axis-parallel
A Simple Classifier: Minimum Distance Classifier • Training • Separate training vectors by class • Compute the mean for each class, mk, k = 1,… m • Prediction • Compute the closest mean to a test vector x’ (using Euclidean distance) • Predict the corresponding class • In the 2-class case, the decision boundary is defined by the locus of the hyperplane that is halfway between the 2 means and is orthogonal to the line connecting them • This is a very simple-minded classifier – easy to think of cases where it will not work very well
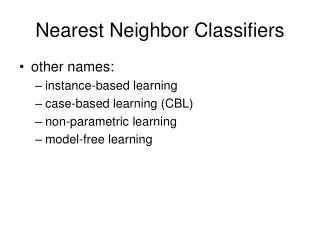
Another Example: Nearest Neighbor Classifier • The nearest-neighbor classifier • Given a test point x’, compute the distance between x’ and each input data point • Find the closest neighbor in the training data • Assign x’ the class label of this neighbor • (sort of generalizes minimum distance classifier to exemplars) • If Euclidean distance is used as the distance measure (the most common choice), the nearest neighbor classifier results in piecewise linear decision boundaries • Many extensions • e.g., kNN, vote based on k-nearest neighbors • k can be chosen by cross-validation
Local Decision Boundaries Boundary? Points that are equidistant between points of class 1 and 2 Note: locally the boundary is linear 1 2 Feature 2 1 2 ? 2 1 Feature 1
Finding the Decision Boundaries 1 2 Feature 2 1 2 ? 2 1 Feature 1
Finding the Decision Boundaries 1 2 Feature 2 1 2 ? 2 1 Feature 1
Finding the Decision Boundaries 1 2 Feature 2 1 2 ? 2 1 Feature 1
Overall Boundary = Piecewise Linear Decision Region for Class 1 Decision Region for Class 2 1 2 Feature 2 1 2 ? 2 1 Feature 1
Nearest-Neighbor Boundaries on this data set? Predicts blue Predicts red
The kNN Classifier • The kNN classifier often works very well. • Easy to implement. • Easy choice if characteristics of your problem are unknown. • Can be sensitive to the choice of distance metric. • Can encounter problems with training sparse data. • Can encounter problems in very high dimensional spaces. • Most points are corners. • Most points are at the edge of the space. • Most points are neighbors of most other points.
Linear Classifiers • Linear classifier single linear decision boundary(for 2-class case) • We can always represent a linear decision boundary by a linear equation: w1 x1 + w2 x2 + … + wd xd = S wj xj = wtx = 0 • In d dimensions, this defines a (d-1) dimensional hyperplane • d=3, we get a plane; d=2, we get a line • For prediction we simply see if S wj xj > 0 • The wi are the weights (parameters) • Learning consists of searching in the d-dimensional weight space for the set of weights (the linear boundary) that minimizes an error measure • A threshold can be introduced by a “dummy” feature that is always one; it weight corresponds to (the negative of) the threshold • Note that a minimum distance classifier is a special (restricted) case of a linear classifier
The Perceptron Classifier (pages 729-731 in text) • The perceptron classifier is just another name for a linear classifier for 2-class data, i.e., output(x) = sign( S wj xj ) • Loosely motivated by a simple model of how neurons fire • For mathematical convenience, class labels are +1 for one class and -1 for the other • Two major types of algorithms for training perceptrons • Objective function = classification accuracy (“error correcting”) • Objective function = squared error (use gradient descent) • Gradient descent is generally faster and more efficient – but there is a problem! No gradient!
Two different types of perceptron output x-axis below is f(x) = f = weighted sum of inputs y-axis is the perceptron output Thresholded output (step function), takes values +1 or -1 o(f) f Sigmoid output, takes real values between -1 and +1 The sigmoid is in effect an approximation to the threshold function above, but has a gradient that we can use for learning s(f) f • Sigmoid function is defined as • s[ f ] = [ 2 / ( 1 + exp[- f ] ) ] - 1 • Derivative of sigmoid • ¶s/df [ f ] = .5 * ( s[f]+1 ) * ( 1-s[f] )
Squared Error for Perceptron with Sigmoidal Output • Squared error = E[w] = Si [ s(f[x(i)]) - y(i) ]2 where x(i) is the ith input vector in the training data, i=1,..N y(i) is the ith target value (-1 or 1) f[x(i)] = S wj xj is the weighted sum of inputs s(f[x(i)]) is the sigmoid of the weighted sum • Note that everything is fixed (once we have the training data) except for the weights w • So we want to minimize E[w] as a function of w
Gradient Descent Learning of Weights Gradient Descent Rule: wnew = wold - h D ( E[w] ) where D (E[w]) is the gradient of the error function E wrt weights, and h is the learning rate (small, positive) Notes: 1. This moves us downhill in directionD ( E[w])(steepest downhill) 2. How far we go is determined by the value ofh
Gradient Descent Update Equation • From basic calculus, for perceptron with sigmoid, and squared error objective function, gradient for a single input x(i) is D ( E[w] ) = - ( y(i) – s[f(i)] ) ¶s[f(i)] xj(i) • Gradient descent weight update rule: wj = wj + h ( y(i) – s[f(i)] ) ¶s[f(i)] xj(i) • can rewrite as: wj = wj + h * error * c * xj(i)
Pseudo-code for Perceptron Training • Inputs: N features, N targets (class labels), learning rate h • Outputs: a set of learned weights • Initialize each wj (e.g.,randomly) • While (termination condition not satisfied) • for i = 1: N % loop over data points (an iteration) • for j= 1 : d % loop over weights • deltawj = h ( y(i) – s[f(i)] ) ¶s[f(i)] xj(i) • wj = wj + deltawj • end • calculate termination condition • end
Comments on Perceptron Learning • Iteration = one pass through all of the data • Algorithm presented = incremental gradient descent • Weights are updated after visiting each input example • Alternatives • Batch: update weights after each iteration (typically slower) • Stochastic: randomly select examples and then do weight updates • A similar iterative algorithm learns weights for thresholded output (step function) perceptrons • Rate of convergence • E[w] is convex as a function of w, so no local minima • So convergence is guaranteed as long as learning rate is small enough • But if we make it too small, learning will be *very* slow • But if learning rate is too large, we move further, but can overshoot the solution and oscillate, and not converge at all
Support Vector Machines (SVM): “Modern perceptrons”(section 18.9, R&N) • A modern linear separator classifier • Essentially, a perceptron with a few extra wrinkles • Constructs a “maximum margin separator” • A linear decision boundary with the largest possible distance from the decision boundary to the example points it separates • “Margin” = Distance from decision boundary to closest example • The “maximum margin” helps SVMs to generalize well • Can embed the data in a non-linear higher dimension space • Constructs a linear separating hyperplane in that space • This can be a non-linear boundary in the original space • Algorithmic advantages and simplicity of linear classifiers • Representational advantages of non-linear decision boundaries • Currently most popular “off-the shelf” supervised classifier.
Multi-Layer Perceptrons (Artificial Neural Networks) (sections 18.7.3-18.7.4 in textbook) • What if we took K perceptrons and trained them in parallel and then took a weighted sum of their sigmoidal outputs? • This is a multi-layer neural network with a single “hidden” layer (the outputs of the first set of perceptrons) • If we train them jointly in parallel, then intuitively different perceptrons could learn different parts of the solution • They define different local decision boundaries in the input space • What if we hooked them up into a general Directed Acyclic Graph? • Can create simple “neural circuits” (but no feedback; not fully general) • Often called neural networks with hidden units • How would we train such a model? • Backpropagation algorithm = clever way to do gradient descent • Bad news: many local minima and many parameters • training is hard and slow • Good news: can learn general non-linear decision boundaries • Generated much excitement in AI in the late 1980’s and 1990’s • Techniques like boosting, support vector machines, are often preferred
Naïve Bayes Model (section 20.2.2 R&N 3rd ed.) Xn X1 X3 X2 C • Bayes Rule: P(C | X1,…Xn) is proportional to P (C) Pi P(Xi | C) • [note: denominator P(X1,…Xn) is constant for all classes, may be ignored.] • Features Xi are conditionally independent given the class variable C • choose the class value ci with the highest P(ci | x1,…, xn) • simple to implement, often works very well • e.g., spam email classification: X’s = counts of words in emails • Conditional probabilities P(Xi | C) can easily be estimated from labeled date • Problem: Need to avoid zeroes, e.g., from limited training data • Solutions: Pseudo-counts, beta[a,b] distribution, etc.
Naïve Bayes Model (2) P(C | X1,…Xn) = a P P(Xi | C) P (C) Probabilities P(C) and P(Xi | C) can easily be estimated from labeled data P(C = cj) ≈ #(Examples with class label cj) / #(Examples) P(Xi = xik | C = cj) ≈ #(Examples with Xi value xik and class label cj) / #(Examples with class label cj) Usually easiest to work with logs log [ P(C | X1,…Xn) ] = log a + [ log P(Xi | C) + log P (C) ] DANGER: Suppose ZERO examples with Xi value xik and class label cj ? An unseen example with Xi value xik will NEVER predict class label cj ! Practical solutions: Pseudocounts, e.g., add 1 to every #() , etc. Theoretical solutions: Bayesian inference, beta distribution, etc.