Download
1 / 26
260 likes | 379 Views
EAS303: Monitoring EA Server - A Unique Way to Monitor and Tune the Whole Application. Chris Bohne Consultant, Architected Solutions, Inc chris@architected-solutions.com Karen McDonald Consultant, Architected Solutions, Inc karen@architected-solutions.com August 15-19, 2004.

E N D
EAS303: Monitoring EA Server - A Unique Way to Monitor and Tune the Whole Application Chris Bohne Consultant, Architected Solutions, Inc chris@architected-solutions.com Karen McDonald Consultant, Architected Solutions, Inc karen@architected-solutions.com August 15-19, 2004
Why Monitor EA Server? • Typical Questions. • What should the maximum pooled value for a component be? • What components are being accessed most in my application? • What are the peak usage days and hours of my application, or of each component of my application? • Why is everyone complaining the system is slow today?
Statistics and information. • Total number of EA Server requests. • What sections are (and are not) being accessed. • Total method invocations on each component. • Quickly identify performance problem with new releases. • Ability to graph peak days and hours both system wide and by component. • Quickly identify DB problems. • Performance tuning.
Monitoring Tools • Jaguar Manager • Prior to EA Server 5 you could only connect to a single server at a time. • No ability to collect information. • Jag Monitor – PowerObjects. • PowerBuilder source code. • Connect to monitor multiple servers . • http://www.powerobjects.com/jaguar/jagmon.html • Write your own (Custom Package) (Location of constants $Jaguar\include\jaguar.hpp)
Jag Monitor • Original Code • Available from PowerObjects. • Allowed connection to multiple servers. • Modified original. • Collect server information. • View entire contents of EA Server log files. • Provide graphic monitoring of servers • Allow for drill down capability on components. • Add data collection capability.
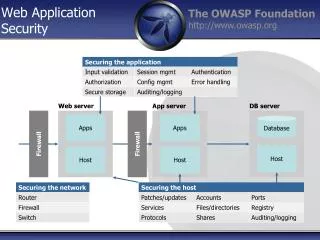
Application Architecture • Minimize the number of entry points into the EA Server • Current application has a single point of entry called the Request Broker • Create a common naming convention for packages. • Prefix package names with something unique i.e. Rep_, OLTP_
Sample Screens • Normal
Sample Screens • Possible Server Issue.
Sample Screens • Possible DB Problem
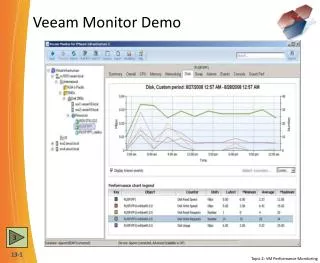
Sample Screens • Chart View
Sample Screens • Chart View – Possible Problem
Using a Custom Package • Why – To collect additional information from server. • Move Jaguar/Monitoring code to a custom class. • Use calls to custom class to collect information. • Cluster. • To guarantee information from the correct server use ORBPROXY Host when connecting to server.
Sample Screens – Using Custom Package • Additional Information
Write Your Own • Jaguar/Monitoring Package • Interface documented in Jaguar Help System • Constants located in $Jaguar\include\jaguar.hpp
Logging System • Use logging to report problems. • 10,000 users across the State of Texas. Many don’t report problems. • Set thresholds so that any request that takes longer than the threshold is written to the log. • Log database errors. • Log component errors
Benchmark Utility • Original code • Benchmark code supplied with PowerBuilder. • Customize it for type of operations used by your applications. • What is it good for? • Evaluating platforms. • Evaluating versions. • Evaluating encryption.
Questions. • Contact • Chris Bohne • 775-790-3018 • ccbohne@yahoo.com • Karen McDonald • 775-790-1020 • klmcdon@yahoo.com