Download
1 / 2
20 likes | 116 Views
The Virtual Institute of Microbial Stress and Survival. Computational Core. Rapid Deduction of Stress Response Pathways in Metal/Radionuclide Reducing Bacteria. Comparative Genomics. b. Principal Investigators Adam Arkin, Inna Dubchak, Frank Olken and Collaborators

E N D
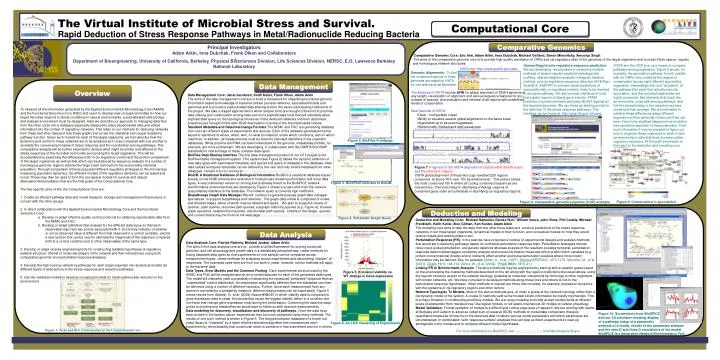
The Virtual Institute of Microbial Stress and Survival. Computational Core Rapid Deduction of Stress Response Pathways in Metal/Radionuclide Reducing Bacteria Comparative Genomics b Principal InvestigatorsAdam Arkin, Inna Dubchak, Frank Olken and Collaborators Department of Bioengineering, University of California, Berkeley, Physical Biosciences Division, Life Sciences Division, NERSC, E.O. Lawrence Berkeley National Laboratory Comparative Genomic Core:Eric Alm, Adam Arkin, Inna Dubchak, Michael Gelfand, Simon Minovitsky, Amoolya Singh The aims of the comparative genomic core is to provide high quality annotation of ORFs and cis-regulatory sites in the genomes of the target organisms and to predict their operon, regulon and homologous network structures Operon/Regulon/cis-regulatory sequence prediction: We are developing mechanisms of combining multiple methods of operon/regulon prediction (phylogenetic profiling, nearest neighbor analysis, intergenic distance metrics), and cis-regulatory sequence detection (ACEAlign, ScanACE, EMOTIF) to provide robust predictions of transcriptionally co-regulated proteins likely to be involved in the same pathway. We also provide interfaces to tools that predict regions of lateral gene transfer, PFAM prediction of protein domains and basic BLAST against all the bacterial genomes. We use these as starting points for the definition of the stress response pathways. The interface can be found at: http://sinai.lbl.gov/~khuang. VISTA and the CGP give us a means to compare pathways among organisms. Figure 9 shows, for example, the sporulation pathway from B. subtilis with it’s ORFs color coded by the degree of conservation across eight different sporulating organisms. Interestingly, the core “actuators” of the pathway (the parts that actually execute sporulation, and the central phosphorelay are highly conserved. But elements that touch the environments, cross-talk among pathways, and link the phosphorelay to the actuators are less conserved than average. We are interested in whether these differences adapt different organisms to their particular niches and if we can learn from niche-stratified diagrams how evolution has canalized regulation in these pathways. From such information it may be possible to figure out how to engineer these organisms to work in new environments or stimulate them to make certain regulatory decisions. All this path information is then sent to the deduction and modeling core. VISTA tool: http://www-gsd.lbl.gov/vista Genomic Alignments: To find the conserved regions of three genomes are adapting VISTA for use with bacterial genomes. Data Management Overview • The Modules of VISTA include AVID for global alignment of DNA fragments of any length, visualization of alignment and various sequence features for any number of species, and evaluation and retrieval of all regions with predefined levels of conservation. • Main features of VISTA: • Clear , configurable output • Ability to visualize several global alignments on the same scale • Alignments up to several megabases • Working with finished and draft sequences Data Management Core: Janet Jacobsen, Keith Keller, Frank Olken, Adam Arkin The aims of the data management core are to build a framework for integrating functional genomic information keyed to knowledge of bacterial cellular process networks, associated models and genomes and to provide a sophisticated data sharing tools to the seven participating institutions of the project. We take a staged approached in which simpler tools are brought online first to promote data sharing and collaboration among sites and more sophisticated tools that will ultimately allow sophisticated query on the topological structures of the deduced networks and their dynamical properties are brought online later. Brief descriptions of some of the important tasks follows. Standard Metadata and Data Interchange Formats The AEMC and FGC are generating datasets from over ten different types of experiments and devices. Each of the datasets generated must be keyed to identifiers of where, when, who, on what biomaterial, under which conditions, and on which machines. In addition, all measurements must be linked to standard identifiers in the organism databases. While proteins and RNA can been linked back to the genome, metabolites profiles, for example, are more problematic. We are developing, in collaboration with the DARPA BioCOMP, standards for interachange of these complex data types. BioFiles Data Sharing Interface The first data management product of our GTL project is the BioFiles flatfile management system. This system (see Figure 2) allows the dynamic definition of new data types with associated metadata, and upload and query of datasets in the database. New data upload and query templates can be defined by the user and may inherit metadata from other datatypes. Version 0.8.0 is running at http://tayman.lbl.gov/perl/biofiles. BioDB: A Relational Database of Biological Information BioDB is a relational database based loosely on the NCBI schema and extended to hold process modeling information and more data types. A very preliminary version is running and is already linked to the BioSPICE network bioinformatics environment we are developing. Figure 3 shows a screen shot from the network query/display interface to the database. The network query is currently high inefficient. Biopathways Graph Data Manager We will construct a general purpose graph data manager specialized to support biopathways and networks. The graph data model is comprised of nodes and directed edges, either of which may be labeled and typed. We plan to support a variety of queries: path queries, recursive path queries, subgraph matching queries (e.g. Figure 4), boolean graph operators, neighborhood queries, and shortest path queries . Details of the design, queries, and current status may be found at the web page: http://www.lbl.gov/~olken/graphdm/graphdm.htm • To interpret all the information generated by the Applied Environmental Microbiology Core (AEMC) and the Functional Genomics Core (FGC) and use it to develop new conceptual models for how our target microbes respond to stress conditions in natural environments, a sophisticated data storage and analysis environment must be designed. Here we describe our approach to managing data flow from the other cores into a database especially designed to place experimental data and edited information into the context of regulatory networks. This relies on our methods for deducing networks from these and other data and how these graphs are turned into statistical and causal models for pathway function. Given such models for each of the target organisms, we first describe how the dynamics and control in these networks are to be analyzed and cross-compared with one another to elucidate the conserved principles of stress response and the coordination among pathways. This comparative analysis will be further extended to deduce what might be similar and different in the stress responses of the microbial community surrounding the target organisms. This will be accomplished by examining the differences both in cis-regulatory control and the protein complement of the target organisms, as well as that which can be deduced by sequence analysis of a number of homologous genomic regions obtained by large insert cloning from the surrounding microbial population. Through comparison of these proposed different regulatory strategies to the microarrays measuring population dynamics, the different models of the regulatory dynamics can be tested and tuned. These may then be used to form the conceptual models for survival and natural attenuation/bioremediation that are the final goals of the Computational Core. • The five specific aims of this the Computational Core are: • 1. Create an efficient pathway data and model transport, storage and management infrastructure in concert with the other groups. • 2. In direct collaboration with the Applied Environmental Microbiology Core and the Functional Genomics Core: • a. Develop or adapt effective quality control protocols for obtaining reproducible data from the AEMC and FGC. • b. Develop or adapt statistical data analysis for the different data types so that each observable may have two scores associated with it: (i) a binary indicator of whether or not an observed value is different from that observed in a control condition, and (ii) a real number that can be used to estimate the magnitude of the response compared both to a control condition and to other observables of the same type. • 3. Develop or adapt reverse engineering tools for constructing testable hypotheses of regulatory network structure (the list of molecular players in the network and their interactions), using both comparative genomic and perturbation/response analyses. • 4. Develop the high-scoring network hypotheses for each target organism into dynamical models (at different levels of abstraction) of the stress-response and reduction pathways. • 5. Use the validated models to develop conceptual models for metal/radionuclide reduction in the environment Figure 2. BioFiles Frontpage. Figure 7. Fragment of the VISTA alignment of Desulfovibrio desulfuricans and Desulfovibrio vulgaris. VISTA global alignment of these two bugs revealed 225 regions conserved at above 75% over 100 bp window level. This picture shows the most conserved 150 K where all coding conserved sequences are colored blue. This tools helps in identifying orthologs, regions of conserved gene order and ultimately in identifying cis-regulatory regions. Figure 3. BioSPICE interface to BioDB. Figure 9. Conservation in sporulation. Figure 8. Comparative genomics pipeline (CGP) example. Deduction and Modeling Figure 4. Schematic Graph Query. Deduction and Modeling Core: Michael Samoilov, Denise Wolf, William Vance, John Ross, Phil Colella, Michael Frenklach, Keith Keller, Alex Gilman, Ken Koster, Adam Arkin The modeling core aims to take the data from the other three tasks and produce predictions of the stress response networks in our three target organisms, dynamical models of their function, and conceptual models for how they would reduce metals and radionuclides in soil. Perturbation Response (PR). In the past we have proposed a number of experimental designs and analysis methods that would aid in deducing pathways based on controlled perturbation response trials. Perturbation strategies include noise input, pulse perturbation, and genetic deletions whereas analysis of the resultant, possibly temporal, perturbation response data includes lagged-correlation analysis and mutual information measures which predict which variables (e.g. protein concentrations) directly and/or indirectly effect another and pulse perturbation analysis where more kinetic information may be derived. See, for example, (Arkin, A., et al. (1997). Science277(5330): 1275-1279. Samoilov, M., et al. (2001). Chaos11(1): 108-114. Vance, W., et al. (2002). PNAS99(9): 5816-21.) Linking PR to Bioinformatic Analysis. The above methods may be augmented by starting with a network guess based on the enumerating the clustering methods described on the left along with the regulon predictions discussed above, using the regulon structure as part of the network topology, guessing at molecular interactions by homology to other organisms with known networks, etc. We have compiled or developed methods along these lines and others to link to the perturbation/response hypotheses.Other methods of interest are those that correlate, for example, expression dynamics with the presence of cis-regulatory regions and other factors. Network Topologies To Models. Most of the above methods give, at most, a guess at the network topology rather than a full dynamic model of the system. A couple of methods yield some modest kinetic information but hardly mechanistic. This is a major limitation in constructing predictive models. We are using modeling tools that accept models builts at different levels of abstraction from “decision tree”-like logical models, to full spatio-mechanical 3D models of cellular physiology. Model Validation. Formal validation of models is a difficult and cutting-edge area of research. We are working with teams at Berkeley and Caltech to adopt so-called sum-of-squares (SOS) methods of model/data comparison that give quantitative measures of how much the observed data constrain various model parameters and which parameters are unconstrained. In combination, with “response surface” analyses this can help us direct experiments to clear up amibiguities in the models and to compare different model hypotheses. Data Analysis Data Analysis Core: Patrick Flaherty, Michael Jordan, Adam Arkin The aims of the data analysis core are to: provide a unified framework for scoring functional genomic, and cell physiology and growth data in a statistically principled way, create methods for fusing disparate data types so that experiments on one sample can be compared across measurement types, create methods for analyzing across experiments and discovering “classes” of responses. The examples used here are from our work in yeast, however, similar methods will apply to the bacterial data. Data Types, Error Models and the Common Footing. Each experimental protocol used by the AEMC and FGC will be analyzed and an error model deduced for each of the generated data types. The model will ultimately yield a probability of observing the measured “perturbed” response from an “unperturbed” control distribution. An observation significantly different from the standards can then be defined a using a number of different heuristics. Further, since each measurement from any device is converted to a probability measure, different measurments can be fused easily. Figure 5 shows results from Giaever, G. et al. (2002) Nature.418:387 in which viability data is compared to gene expression data in yeast. Knockouts that cause the biggest viability defect in a condition are not those that change gene expression most during the perturbation. Combining the data this ways points to proteins and metabolites we would want to follow up with directed measurements. Data modeling for discovery, visualization and discovery of pathways. Once the data have been scored in the fashion above, experiments may be cross-compared using many methods. The results of one such method is shown in Figure 6. The drug perturbation database of a knock-out yeast library is “clustered” by a latent dirichlet allocation algorithm that characterizes each experiment by the probability that a particular strain is sensitive in that experiment and not in others. Figure 5. Knockout viability vs. WT change in Gene expression Figure 10. Screenshots from BioSPICE and our 3D simulator showing display of a pathway, setup of a parametric analysis of a model, results of the parametric analysis and the zero-D and three D simulations of the model. BioSPICE is a Integration Network Bioinformatics Tool. Figure 6. An LDA Clustering of Experiments. Figure 1. Tasks and flow of information in the Computational Core For more information on BioSPICE see: http://biospice.org and http//biospice.lbl.gov
VIRTUAL INSTITUTE FOR MICROBIAL STRESS AND SURVIVAL Overview and organization Authors information ABSTRACT CONCLUSION Add text here Add text here RESULTS Add text here MATERIALS & METHODS Add text here ABSTRACT REFERENCES Add text here ACKNOWLEDGEMENTS Add text here