Download
1 / 80
1.04k likes | 1.79k Views
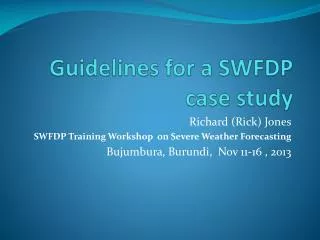
Disease Forecasting: TOMCAST as a case study PP 603. Jim Jasinski OSU Extension Integrated Pest Management Program. Outline of Topics. Industry Overview Disease model basics TOMCAST History Research Equipment Exercise Weather / disease forecasting networks

E N D
Disease Forecasting:TOMCAST as a case studyPP 603 Jim Jasinski OSU Extension Integrated Pest Management Program
Outline of Topics • Industry Overview • Disease model basics • TOMCAST • History • Research • Equipment • Exercise • Weather / disease forecasting networks • OWN / WIN, NA Disease Forecast Center, MAWN • SkyBit website and resources
OH Tomato Industry Overview • Whole pack, paste, fresh market • Ohio Ag statistics – proc. tomato • From 1999 - 2008, $13 M - 18 M • From 1999 – 2008, 17,700 - 5,900 A • Ohio Ag Statistics – fresh market • From 1999 – 2008, $28 M - 61 M • From 1999 – 2008, 4,900-6,000 A • 2007 OMAFRA • 18,000 A of processing tomatoes in Ontario • ca. $74 M
Environment Pathogen Host Classic Disease Triangle Disease
Classic Disease Triangle + Time Environment Disease Disease Disease Disease Disease Disease Disease Disease Pathogen Host Time
What is a Disease Forecasting Model? • A set of formula’s, rules, tables, or algorithms patterned after the biology of a specific pathogen • Models are driven by observed or forecasted weather conditions for each location • air temperature • relative humidity • leaf wetness (dew) • precipitation • others
Why Use Forecasting Models? • Alternative to calendar spray programs • Enhance timing of fungicide sprays based on disease development • Spray reduction may be possible • Economic benefits • Environmental benefits
3 Stages of a Model • Development • Assumptions & monitoring variables • Validation • Testing the assumptions • Implementation • Grower trials, release to public
1. Model Development • Models typically are developed from a combination of laboratory and field studies • The goal is to predict the risk of disease and/or development of inoculum • Need to identify key environmental and host variables • Air temperature, relative humidity, hours of free moisture (dew), precipitation, host growth stages, etc. • Based on management options and goals, action thresholds can be incorporated into the model to provide advice on fungicide applications
2. Model Validation • Descriptive models must be validated across a variety of microclimates over a number of years • Pilot studies (multiple locations) • Multiple seasons (hot, cold, wet, dry weather) • Sensor placement (canopy v. field edge?) • Revise and refine based on results • Models developed in one area are frequently validated by researchers in other areas; may need region-specific modifications • Plants treated according to the model are compared to disease levels managed by traditional spray schedules as well as unsprayed plots
3. Model Implementation • Predictive models require local weather inputs • On-site data logger or access to forecasted data • air temperature, RH, precipitation, etc. • Quality data very important (GIGO) • Initial implementation efforts are supported by • Industry, University researchers, & Extension agents • Through field days, demonstrations, and on-farm trials • Programs can be transferred from public (University) to the Private domain (consultants / industry / subscription service) for maintenance • Growers and pest control advisors can use disease risk indices (DSV) for enhanced crop management
More Models - UC Davis IPM http://www.ipm.ucdavis.edu/GENERAL/tools.html
Online disease forecasting models http://www.ipm.ucdavis.edu/DISEASE/DATABASE/diseasemodeldatabase.html#DISEASEMODEL
Disease Forecasting Models/Networks • EPIDEM- Alternariasolani on tomatoes & potatoes • FAST - Forecasting Alternariasolani on tomatoes • TOMCAST-Alternaria, (Septoria, anthracnose) • WISDOM (BLITECAST)- Late blight on tomatoes & potatoes • MELCAST- Anthracnose, gummy stem blight(Watermelons), Alternaria (Muskmelons ) • Maryblight- Fireblight on apples • EPIVEN- Apple scab on apples • EPICORN- Southern corn leaf blight • North American Blue Mold warning system- Tobacco • North American Plant Disease Forecast Center-Cucurbit Downy Mildew, Soybean Rust, Tobacco blue mold • Weather Innovations Incorporated – DONcast, SPUDcast, TOMcast, BEETcast • Michigan Automated Weather Network-TOMCAST, Potato late blight, others
TOMCAST TOMato disease foreCASTing • Purpose: Assist processing tomato growers with fungicide application timing based on early blight development, using a “protectant” fungicide program • Use local weather to guide fungicide schedule • Alternative to 7-14 day calendar spray programs • Only a PART of the Disease management component of an overall IPM Program for tomatoes
NOT PREDICTED -Viral (TSWV), Bacterial (Canker, Speck, Spot), Fungal (Late Blight??) PREDICTED TOMCAST Disease Spectrum “Bonus Diseases” *Anthracnose Early Blight Clemson University *Septoria leaf spot
Factors Affecting Early blight • Early blight spores need free moistureto germinate and infect tomato plant tissue. If the leaf surface is dry, the fungal spore just sits there...and waits. • The rate or speed of infection is determined by temperature. The cooler the temperature the slower the process whereas the warmer the temperature the faster infection takes place, disease occurs. • An environmental factor (moisture) starts the disease and another environmental factor (temperature) speeds up or slows down the progress of the disease.
Alternaria biologyEnvironmental Conditions for Germination & Sporulation • Alternaria spores • Germinate within 2 hours over a wide range of temperatures but at 80 to 85oF may only take 1/2 hour. • Another 3 to 12 hours are required for the fungus to penetrate the plant depending on temperature. • After penetration, lesions may form within 2-3 days or the infection can remain dormant awaiting proper conditions (60oF and extended periods of wetness). • Alternaria sporulates best at about 80oF when abundant moisture is present (rain, mist, fog, dew, irrigation). Infections are most prevalent on poorly nourished or otherwise stressed plants.
Protectant Fungicide Activity Protectants Germination Penetration Infection Sporulation Chlorothalonil EBDC’s Strobilurins NA for tom’s
TOMCASTDisease Severity Value (DSV) Chart • TOMCAST DSV generated on 24 hour intervals • Calculation requires leaf wetness and air temperature inputs • Count # leaf wet hours, average temperature during those leaf wet hours, determine the daily DSV
TOMCASTDisease Severity Value Chart • 0-Environ. conditions unfavorable for disease development* (g,p,i,s) • 4-Environ. conditions highly favorable for disease development*
TOMCAST Math • Add daily DSV until spray threshold is reached or exceeded • 15 – 20 DSV is the usual spray threshold or spray interval • Example: • Monday 10 lw hrs 65 F 2 DSV • Tuesday 7 lw hrs 75 F 2 DSV • Wednesday 13 lw hrs 72 F 3 DSV • Thursday 9 lw hrs 69 F 2 DSV • Friday 16 lw hrs 78 F 3 DSV • 5 days 12 DSV
TOMCAST History • Original Model- FAST • Forecasting Alterneriasolani on Tomatoes • Pennsylvania State College, Late 70’s • Air Temp & Wetness variables • Rain and Dew models • DSV’s averaged 5 or 7 days • BLITECAST is born • NY CU-FAST • Cornell Univ. (1989) • Sold CU-FAST • Privatized (1992) • charge fee for use PENNSYLVANIA NEW YORK
TOMCAST History • 1979 Ontario, Canada • FAST system unacceptable (complex, hardware) • 1985 • TOMCAST is born (R. Pitblado) • Used datalogger w/ “new” dew sensor • Daily DSV calculations • 1987 • Industry & University Support • Grower trials begin • 2000-present Ontario Weather Network became Weather Innovations Inc.,Tomcast, Beetcast, etc. CANADA
MIDWEST OH, IN, MI TOMCAST History • 1988TOMCAST arrives in Midwest • University & Industry supported research • Heinz, Campbell’s, Hirzel • 1992 Grower Trials • Datapod Recorders • 1993 Upgraded to CR10 Equipment • 1995 Network expands • BLITECAST, Fresh Market, Whole pack, Skybit • 1999 14 CR10 stations, mature research & service program • 2000 Program review - proc. tomatoes decline (5K A), TOMCAST discontinued in Midwest
Research (Development & Validation) 1988-1991 Split plot research on commercial farms Disease, insect, & yield data collected Spray program of TOMCAST v. Calendar (UTC?) Can reduce chemical inputs (25-40%) Produces quality = or > calendar program Extension & Service (Implementation) 1992-1999: Recruit growers & expand network (14 sites) Educational focus, how to use, support, data dissemination Continue research aspect, Late blight, SkyBit, Whole pack TOMCAST in Midwest
TOMCAST Conv. TOMCAST – Research Design TOMCAST or Conventional • Scout fields weekly • Harvest plots
TOMCAST EquipmentEarly Years... • Omnidata Datapods • Simple dataloggers • Manually read (15-45 min. daily) • EPROM chips • Data manually recorded & calculated • Reliability issues • Labor intensive • Relatively Cheap
TOMCAST EquipmentLater years... • Campbell Scientific CR10 • Programmable data loggers • Very Reliable • Very low maintenance • Collection via phone lines and modem (now wireless possibilities) • One person can run the entire data collection network • Automatic logging / interrogation of units via telecommunications software • Expensive ($2500 / unit) • Future is web based collection & dissemination
How the “leaf wetness sensor” functions Electrified Copper Grid • Latex paint coated sensor • Dry, max resistance, no conductivity • Increasing moisture, < resistance, • > conductivity
Leaf wetness sensor • Latex paint coated sensor
CR10 “Guts” 1.2 Kb modem
TOMCAST Network Data Retrieval Loop modem modem CR10 central office field
Web Access for Growershttp://vegnet.osu.edu/tomcats/tomfrm.htm
TOMCAST DSV Accumulation Midwest Use Guidelines Initial Spray based on transplanting date • Before May 20th - 25 DSV or fail safe of June 15 • After May 20th - Use Spray threshold (15-20 DSV) Successive sprays based multiples of DSV spray threshold. • 15 DSV, more conservative (> sprays) • 20 DSV, less conservative (< sprays) • Accumulate Daily DSV until threshold reached • 14 day failsafe spray interval
(14 Day) (14 Day) 15 DSV 18 DSV 10 days Cal-10 days 15 DSV 18 DSV DSV Accumulation Ex. - Slow July 14 day spray needed: fungicide degradation and new foliage spray
TC-18 TC-15 Calendar TC-18 TC-15 TC-18 TC-15 10 D Cal. DSV Accumulation Ex. – Rapid Rapid foliage & fruit growth require increased sprays for coverage Spray
Guidelines First Spray ONLY! Transplant before May 20th - 25 DSV or fail safe of June 15 Transplant after May 20th - Use Spray threshold Successive Sprays Calculate sprays at 7 and 10 calendar days Calculate sprays at 15 & 18 DSV Spray at 14 Days if threshold not reached (DNA 1st spray) TOMCAST DSV AccumulationWork Sheet Guidelines
Forces Driving TOMCAST • Limited Fungicide Selection • Prior to 1996 used Delaney clause standard • No (zero) pesticide residues of carcinogenic compounds can be found in processed foods • Eliminated use of EBDC’s (Ethylene bisdithiocarbamate) because of ETU (Ethylene thiourea) metabolite • Thiram, Mancozeb, Ferbam, Ziram, and Zineb • Workhorse is Chlorothalonil • After 1996 Delaney revoked, used FQPA • Standard “reasonable certainty of no harm” • EBDC’s can be used (see above) • New chemistries – Strobulurins (Quadris, Flint) • Effect on DSV action thresholds?
NetworkGeography & Topography • Zones of DSV prediction? • Flat land • ca. 15 miles • Lake effect • ca. 5-10 miles? • Hilly • ca. 5 miles? * * * * * * * * * * • Weather Station or grower *