Download
1 / 17
170 likes | 250 Views
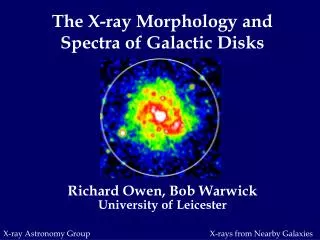
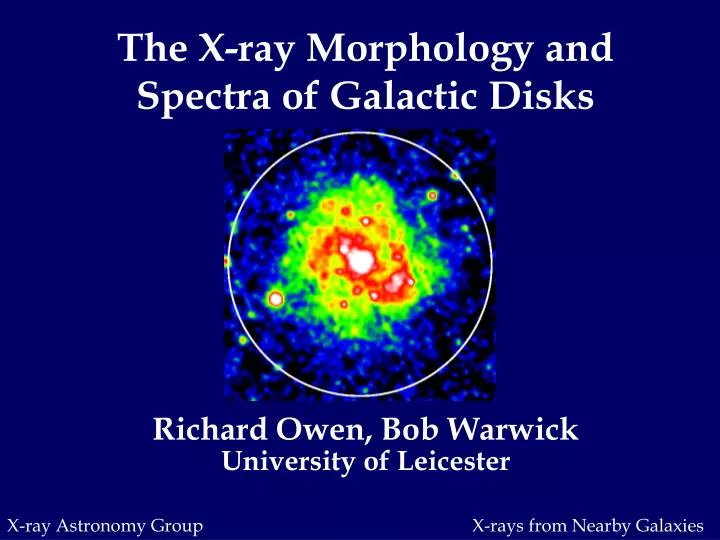
The X-ray Morphology and Spectra of Galactic Disks. Richard Owen, Bob Warwick University of Leicester. X-rays from Nearby Galaxies. Introduction. We use XMM-Newton to analyze disk emission from a sample of nearby face-on spiral galaxies.

E N D
The X-ray Morphology and Spectra of Galactic Disks Richard Owen, Bob Warwick University of Leicester X-rays from Nearby Galaxies
Introduction • We use XMM-Newton to analyze disk emission from a sample of nearby face-on spiral galaxies. • After exclusion of bright X-ray point sources, we investigate: • The spectral components in the galactic disk • The morphology of the residual X-ray emission • Correlation with NUV emission X-rays from Nearby Galaxies
Simulated PSF image of bright point sources. Exclusion of bright X-ray point sources (1) XMM-Newton soft-band (0.3-1 keV) image of M83. X-rays from Nearby Galaxies
Exclusion of bright X-ray point sources (2) Surface brightness cut on simulated image forms source mask. Tails of PSF extending beyond mask are subtracted to produce residual image. X-rays from Nearby Galaxies
Galaxies in the sample X-rays from Nearby Galaxies
OM V OM U GALEX NUV M101: Soft X-ray and NUV emission (1) 0.3-1 keV 10’ ~ 22.6 kpc The central 5’ of the soft X-ray image above and NUV map shown compressed on right with X-ray contours. Warwick et al 2007
M101: Soft X-ray and NUV emission (2) UVW1 0.3-1 keV 10’ ~ 22.6 kpc The correlation between soft X-ray and emission from the XMM OM UVW1 filter is studied within the central 5’ of M101. Warwick et al 2007
M101: Radial distribution and spectral analysis For 0.2 keV component: τcool ≈ 1.8 x 10⁸η½ yr Not compatible with η~1 due to narrow spiral features in soft X-ray. Implies clumpy thin-disk component. Radial distribution: exponential with scalelength 2.6’ (5.4 kpc). Best fit spectral model: two-temperature mekal, kT ≈ 0.2 and 0.7 keV. LX (0.3-2 keV) ≈ 2.6 x 1039 erg s-1 Warwick et al 2007
M83: Soft X-ray and NUV emission (1) 0.3-1 keV UVW1 12.8’ ~ 13.8 kpc XMM-Newton soft X-ray and OM UVW1 images of M83 overlaid with soft X-ray contours. Owen et al 2007 (in prep)
M83: Soft X-ray and NUV emission (2) 0.3-1 keV UVW1 8’ ~ 8.6 kpc Soft X-ray residual and OM UVW1 images are shown overlaid with the bright source mask, showing areas used in correlation analysis. Owen et al 2007 (in prep)
M83: Spectral analysis Best fit spectral model: two-temperature mekal with kT ≈ 0.2 and 0.6 keV. LX (0.3-2 keV) ≈ 1.9 X 1039 erg s-1. Owen et al 2007 (in prep)
M51: Soft X-ray and NUV emission (1) 0.3-1 keV 7’ ~ 14 kpc UVW1 Soft X-ray image and UVW1 image of M51, with X-ray contours shown. X-rays from Nearby Galaxies
M51: Soft X-ray and NUV emission (2) UVW1 0.3-1 keV 7’ ~ 14 kpc Correlation is performed for the regions of M51 not obscured by the source mask, extending out to its D25 radius.
M51: Spectral analysis Best fit spectral model: two-temperature mekal (kT ≈ 0.2, 0.6 keV) with added power-law component (Γ~2.7). LX (0.3-2 keV)≈ 5.2 x 1039 erg s-1. X-rays from Nearby Galaxies
Comparison of soft X-ray versus NUV correlations M101 M83 Correlations give the best fit gradients: M51: 0.040 ± 0.005 M83: 0.088 ± 0.010 M101: 0.041 ± 0.005 These must be corrected for extinction in both X-ray and UV. Extinction corrected 0.038 ± 0.005 0.079 ± 0.010 0.039 ± 0.005 M51 X-rays from Nearby Galaxies
Summary results for diffuse emission X-rays from Nearby Galaxies
Conclusions • X-ray spectra of spiral galaxy disks are typically characterized by two-temperature fits, with kT ≈ 0.2 and 0.6-0.7 keV. • Diffuse emission can be separated into a clumpy component tracing the spiral arms and a broadly exponential lower halo component. • In this study we find very good correlation between soft X-ray emission and NUV emission. • The X-ray/UV count-rate ratio derived is consistent between M51 and M101, but is twice as large in M83. • We note that the result derived for M83 appears to be due to a genuine soft X-ray excess rather than a UV deficit. X-rays from Nearby Galaxies