Download
1 / 38
480 likes | 831 Views
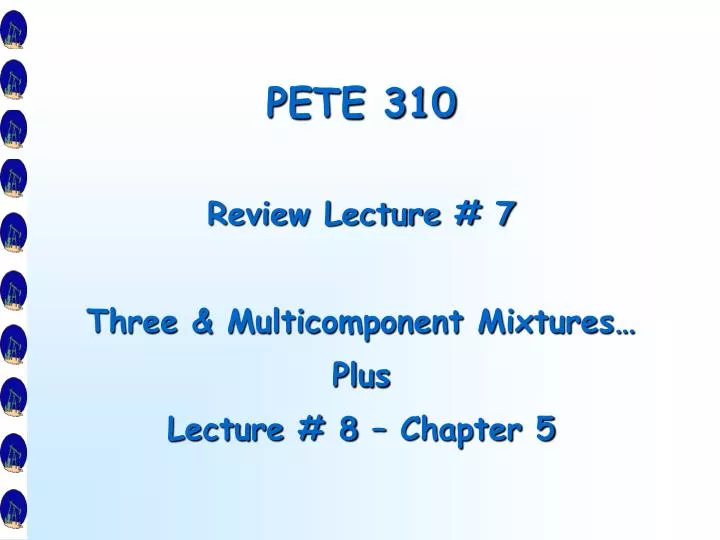
PETE 310. Review Lecture # 7 Three & Multicomponent Mixtures… Plus Lecture # 8 – Chapter 5. Ternary Diagrams: Review. C 1. C 1. C 1. Gas. Gas. Gas. 2-phase. 2-phase. Liquid. Liquid. nC 5. C 3. nC 5. C 3. nC 5. C 3. p=500 psia. p=14.7 psia. p=380 psia. C 1. C 1. C 1.

E N D
PETE 310 Review Lecture # 7 Three & Multicomponent Mixtures… Plus Lecture # 8 – Chapter 5
C1 C1 C1 Gas Gas Gas 2-phase 2-phase Liquid Liquid nC5 C3 nC5 C3 nC5 C3 p=500 psia p=14.7 psia p=380 psia C1 C1 C1 Gas Gas 2-phase 2-phase Liquid Liquid Liquid nC5 C3 nC5 nC5 p=2000 psia p=2350 psia p=1500 psia Ternary Diagrams: Review Pressure Effect C3 C3
Ternary Diagrams: Review Dilution Lines
Ternary Diagrams: Review Quantitative Representation of Phase Equilibria - Tie (or equilibrium) lines • Tie lines join equilibrium conditions of the gas and liquid at a given pressure and temperature. • Dew point curve gives the gas composition. • Bubble point curve gives the liquid composition.
Ternary Diagrams: Review Quantitative Representation of Phase Equilibria - Tie (or equilibrium) lines • All mixtures whose overall composition (zi) is along a tie line have the SAME equilibrium gas (yi) and liquid composition (xi), but the relative amounts on a molar basis of gas and liquid (fv and fl) change linearly (0 – vapor at B.P., 1 – liquid at B.P.).
Uses of Ternary Diagrams Representation of Multi-Component Phase Behavior with a Pseudoternary Diagram • Ternary diagrams may approximate phase behavior of multi-component mixtures by grouping them into 3 pseudocomponents • heavy (C7+) • intermediate (C2-C6) • light (C1, CO2 , N2- C1, CO2-C2, ...)
Uses of Ternary Diagrams Miscible Recovery Processes Solvent2 Solvent1 oil
Exercise Find overall composition of mixture made with 100 moles oil "O" + 10 moles of mixture "A". __________________________ ________________________ _______________________ _____________________ ___________________ _________________
T=180F P=200 psia T=180F P=14.7 psia T=180F P=600 psia Pressure Effect Pressure Effect Pressure Effect Pressure Effect T=180F P=400 psia C1-C3-C10 O O O O Practice Ternary Diagrams Pressure Effect
Pressure Effect Pressure Effect T=180F P=4000 psia T=180F P=1000 psia T=180F P=2000 psia T=180F P=3000 psia T=180F P=1500 psia O O O O O Practice Ternary Diagrams Pressure Effect
Temperature Effect Temperature Effect Temperature Effect Temperature Effect T=100F P=2000 psia T=200F P=2000 psia T=150F P=2000 psia T=300F P=2000 psia O O O O Practice Ternary Diagrams Temperature Effect
Temperature Effect Temperature Effect Temperature Effect T=400F P=2000 psia T=450F P=2000 psia T=350F P=2000 psia O O O Practice Ternary Diagrams Temperature Effect
1-Phase 1-Phase CP Bubble-Curve 60% 0% Reservoir Pressure 20% 2-Phase Dew-Curve Reservoir Temperature Pressure-Temperature Diagram for Multicomponent Systems
t t 1 Production Production t 2 2 Gas Gas Pressure Injection Injection t t 3 3 Temperature Changes During Production and Injection
PETE 310 Lecture # 8: Five Reservoir Fluids (Chapter 5)
PETE 310 - Phase Behavior Pressure vs. Temperature Diagrams • Used to visualize the fluids production path from the reservoir to the surface • To classify reservoir fluids • Visualize miscible processes
1-Phase 1-Phase CP Bubble-Curve 60% 0% Reservoir Pressure 20% 2-Phase Dew-Curve Reservoir Temperature Pressure-Temperature Diagram for Multicomponent Systems
Why do we need to classify Reservoir Fluids? • Determine fluid sampling • Determine types and sizes of surface equipment • Dictate depletion strategy • Determine selection of EOR method • Determine techniques to predict oil & gas reserves • Determine Material Balance calculations
Phase Envelopes Cricondenbar Bubblepoint Curve Critical Fixed Composition Point Dew Point Curve Quality 75% Lines Pressure 50% Cricondentherm 25% Temperature
Classification of Reservoirs based on Phase Diagram • Gas Reservoirs (Single Phase) • Gas Condensate Reservoirs (Dew-Point Reservoirs): • Undersaturated Solution-Gas Reservoirs (Bubble-Point Reservoirs):
Phase envelopes of different mixtures with different proportions of same HC components
Component Black Oil Volatile Oil Gas Condensate Wet Gas Dry Gas C 48.83 64.36 87.07 95.85 86.67 1 C 2.75 7.52 4.39 2.67 7.77 2 C 1.93 4.74 2.29 0.34 2.95 3 C 1.60 4.12 1.74 0.52 1.73 4 C 1.15 3.97 0.83 0.08 0.88 5 C 1.59 3.38 0.60 0.12 6 + C 42.15 11.91 3.80 0.42 7 + M C 225 181 112 157 w 7 GOR 625 2000 18,200 105,000 - o Tank API 34.3 50.1 60.8 54.7 - Liquid Greenish Medium Light Water - Color Black Orange Straw White Typical Reservoir Fluid Compositions
Compositional Distribution of Reservoir Fluids
Classification of Reservoirs based on Production and PVT data GAS CONDENSATE RESERVOIRS: • GOR between 70,000-100,000 SCF/STB • Density greater than 60 ºAPI • Light in color • C7+ composition < 12.5%
Classification of Reservoirs based on Production and PVT data VOLATILE OIL RESERVOIRS: • GOR between1,000-8,000 SCF/STB • Density between 45-60 ºAPI • Oil FVF greater than 2.00 (high shrinkage oils) • Light brown to green in color • C7+ composition > 12.5%
Classification of Reservoirs based on Production and PVT data BLACK OIL RESERVOIRS: • GOR less than 1,000 SCF/STB • Density less than 45 ºAPI • Reservoir temperatures less than 250 ºF • Oil FVF less than 2.00 (low shrinkage oils) • Dark green to black in color • C7+ composition > 30%
Assignment • Read and make a summary of revised & newer criteria for classification of Reservoir Fluids from given paper by William D. McCain in JPT September 1994
JPT paper Study Guide • What are the distinctive features of black oils in terms of • Initial GOR & GOR vs time • Initial API & API vs time • Compositions • Color
JPT paper Study Guide • What are the distinctive features of volatile oils in terms of • Initial GOR & GOR vs time • Initial API & API vs time • Compositions • Color
JPT paper Study Guide • What are the distinctive features of Condensate gasesin terms of • Initial GOR & GOR vs time • Initial API & API vs time • Compositions • Color
JPT paper Study Guide • What are the distinctive features of Dry gasesin terms of • Initial GOR & GOR vs time • Compositions