Download
1 / 13
200 likes | 389 Views
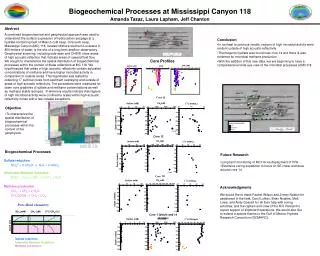
Pore Pressures During CPTU Testing. Robert Jaeger December 06, 2006. CPTU Testing. Records tip resistance, sleeve friction, pore pressure, and shear wave velocity. Figure 1: Illustrative results of SCPTu for geostratigraphic profiling of soils layers in Memphis, Tennessee. (Mayne, 2001) [3].

E N D
Pore Pressures During CPTU Testing Robert Jaeger December 06, 2006
CPTU Testing • Records tip resistance, sleeve friction, pore pressure, and shear wave velocity Figure 1: Illustrative results of SCPTu for geostratigraphic profiling of soils layers in Memphis, Tennessee. (Mayne, 2001) [3]
Excess Pore Pressure Generation • Total excess pore pressure is a sum of shear-induced and normal excess pore pressures Figure 2: Normal- and shear-induced components of excess porewater pressures around the cone [3]
Excess Pore Pressure Variation in Time • Probe is driven at 20mm/sec at increments of 1m • Probe held to a specified depth Figure 3b: Normalized dissipation test results from Bothkennar [2] Figure 3a: Dissipation test results from Bothkennar [2]
Excess Pore Pressure Variation in Time Figure 4: Pore pressure measurements at Sarapui [1]
Usefulness of Pore Pressure Information • Obtain the horizontal coefficient of consolidation, ch • Obtain the horizontal permeability, kh • Gain more information on soil stratigraphy
Procedure for Determining Parameters Using Houlsby and Teh (1988) • Determine rigidity index, Ir G = shear modulus su = undrained shear strength • Determine the time for 50% dissipation and the horizontal coefficient of consolidation, ch Figure 5: Chart for determining the time for 50% dissipation and ch (after Robertson et al., 1992). [2]
Determination of Additional Soil Parameters • Horizontal permeability, kh • Vertical coefficient of consolidation, cv If mh = mv, Figure 6: Comparison of consolidation coefficients from oedometer and piezocone for clays (Burns & Mayne, 1998). [3]
Figure 7: Distribution of Pore Water Pressure at Various Stages of Dissipation (Teh and Houlsby, 1991) [4] Pore Pressure Dissipation Contours • Use Houlsby and Teh (1988) • t = time, a = radius of shaft • ch = horizontal coefficient of consolidation
Evaluation of the Method • Quick and cheap way to get a lot of information • Not always practical • Clays with low permeabilities would take hours or even days to complete the necessary amount of dissipation • Sands and other high permeability soils would dissipate too quickly • Soils are disturbed during testing
References • [1] Danziger, F. A. B., Almeida, M. S. S., and Sills, G. C. (1997). The significance of the strain path analysis in the interpretation of piezocone dissipation data. Géotechnique, 47(5), 901-914. • [2] Lunne, T., Robertson, P. K., and Powell, J. J. M. (1997). Cone penetration testing in geotechnical practice, EF Spon and Routledge, London, 312 pp. • [3] Mayne P. W. (2001). Stress-strain-strength-flow parameters from enhanced in-situ tests. Proceedings of the International Conference on In-Situ Measurement of Soil Properties, Indonesia, 27-48. • [4] Teh, C. I. and Houlsby, G. T. (1991). An analytical study of cone penetration test in clay. Géotechnique, 41(1), 17-34.
Values for M Table 1: Gradient of dissipation curve (M), root time plot (from Teh, 1987). [2] Figure 8: Various pore pressure measurement locations. [2]