Download
1 / 37
370 likes | 505 Views
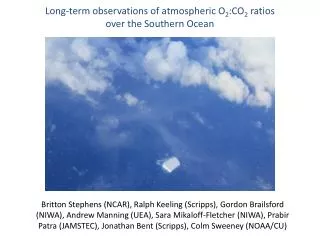
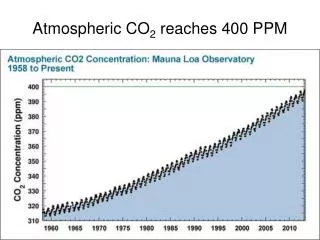
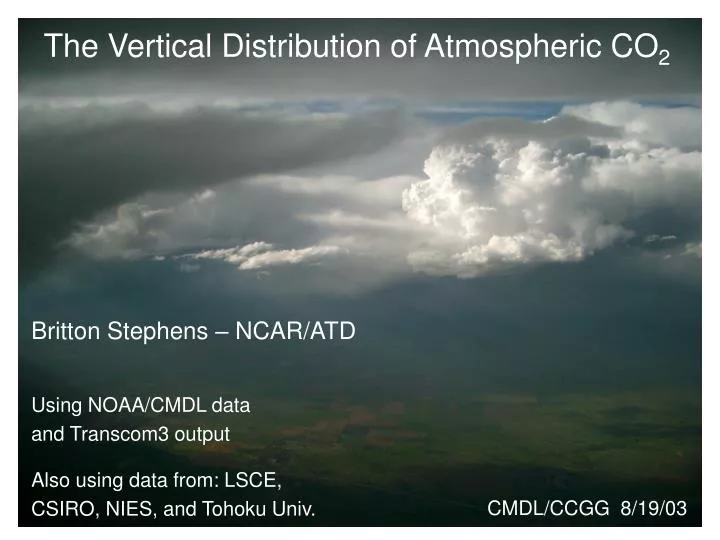
The Vertical Distribution of Atmospheric CO 2. Britton Stephens – NCAR/ATD Using NOAA/CMDL data and Transcom3 output Also using data from: LSCE, CSIRO, NIES, and Tohoku Univ. CMDL/CCGG 8/19/03. Outline Motivation – global inverse model uncertainty Data sources

E N D
The Vertical Distribution of Atmospheric CO2 Britton Stephens – NCAR/ATD Using NOAA/CMDL data and Transcom3 output Also using data from: LSCE, CSIRO, NIES, and Tohoku Univ. CMDL/CCGG 8/19/03
Outline • Motivation – global inverse model uncertainty • Data sources • Model–data comparisons • Caveats, future work • Solicitation of feedback
Annual mean TransCom3 Level 1 Results Gurney et al, Nature, 2002
Annual mean TransCom3 Level 1 Results Gurney et al, Nature, 2002
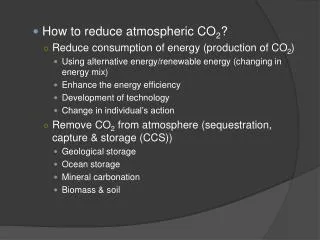
Potential Problems • Data limited • Assuming flux corrections applied evenly across months • No diurnal cycle in the models • Fair weather bias • Heterogeneity, fossil fuel bias • Non-overlapping time periods
Still more data. . . . Ongoing sites not included in analyses: Fortaleza Santarem Hawaii Yakutsk Novosibirsk Sagami Bay FyodorovskoeSyktyvkar Zotino Bialystok Griffin Schauinsland Thüringen Hungary AEROCARB Network
Caveats / Future Work • Diurnal bias • Time of day data analysis • Subsample a diurnally resolved model • Fair weather bias • Look at COBRA data • Subsample a coupled mesoscale model • Heterogeneity, fossil fuel bias • Look at CO data and model FF gradients • Non-overlapping times • Look at Carr and Sendai trends