Download
1 / 15
200 likes | 398 Views
Explore the basics of simulation, system components, modeling, queuing theory, and simulation benefits. Learn to analyze, model, and simulate real-world systems using discrete event simulation concepts.

E N D
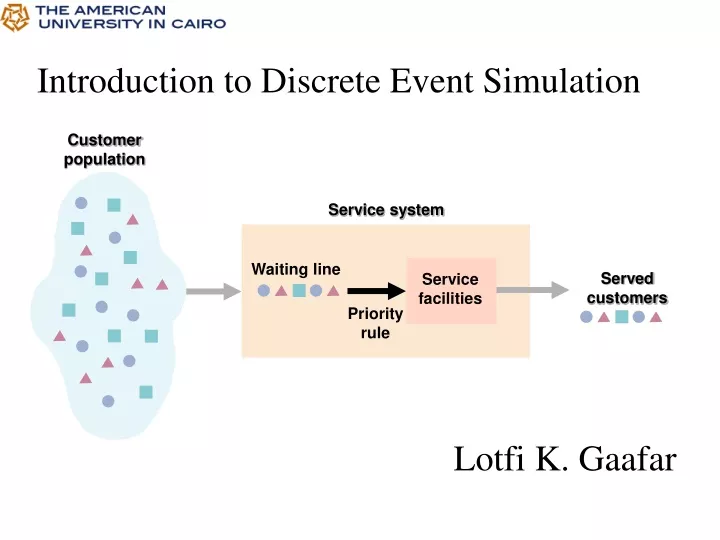
Customer population Service system Waiting line Served customers Service facilities Priority rule Figure C.1 Introduction to Discrete Event Simulation Lotfi K. Gaafar
What is Simulation? “Simulation is the process of designing a model of a real system and conducting experiments with this model for the purpose either of understanding the behavior of the system or of evaluating various strategies (within the limits imposed by a criterion or set of criteria) for the operation of the system.” - R.E. Shannon
What is a System? A system is defined as a group of objects that are joined together in some regular interaction or interdependence toward the accomplishment of some purpose. A system that does not vary with time is static whereas one that varies is dynamic.
Components of a System An entityis an object of interest in the system (flows through the system). An attribute is a property of an entity. A given entity can possess many attributes. A variable is a global value used to track various system activities. An activity represents a time period of specified length. A resource carries out an activity. A Queue is a waiting space for entities when resources are busy. The state of a system is defined to be that collection of variables (e.g. entities, attributes, activities) necessary to describe the system at any time, relative to the objectives of the study. The progress of the system is studied by following the changes in the state of the system. An event is defined as an instantaneous occurrence that may change the state of the system.
What is a Model? A model is a high level specification to abstract from reality a description of a dynamic system. Types of models: physical : scale models, prototype plants, ... mathematical : analytical queuing models, linear programs, simulation, etc. Modeling is a way of thinking and reasoning about systems.
Use of a Model To study system behavior in the design stage, before such systems are built. To communicate a system design To predict the performance of new systems under varying sets of circumstances. “What if” questions about the real-world system.
Simulation Potential Specifying performance requirements Evaluating design alternatives Comparing two or more systems Determining the optimal value of a parameter (system tuning) Finding the performance bottleneck (bottleneck identification) Characterizing the load on the system (workload characterization) Determining the number and sizes of components (capacity planning) Predicting the performance at future loads (forecasting)
Why use Simulation Study none existing systems Faster experiments Cheaper experiments Avoid political problems Try wild ideas Experiment under extreme conditions Training Support operational decisions
STEPS IN SIMULATION STUDY Problem Definition Knowledge/data Acquisition Model Building Model Implementation Model Verification/validation Experiment Design Simulation Runs Output Analysis Problem Solution
Customer population Service system Waiting line Served customers Service facilities Priority rule Figure C.1 The Queuing Model
l m = Average utilization of the server = l m – l L = Average number of customers in the service system = 1 m – l W = Average time spent in the system, including service = M/M/1 Queue: Analytical Solution Exponential arrivals and service times l Arrival Rate m Service Rate Lq = Average number of customers in the waiting line = L Wq = Average waiting time in line = W
Excel Simulation Use ‘–m*ln(R)’ to generate obsevaions from the exponential distribution, where m is the average and R is a random number between 0 and 1 generated using the RAND() function of Excel.