Download
1 / 18
180 likes | 280 Views
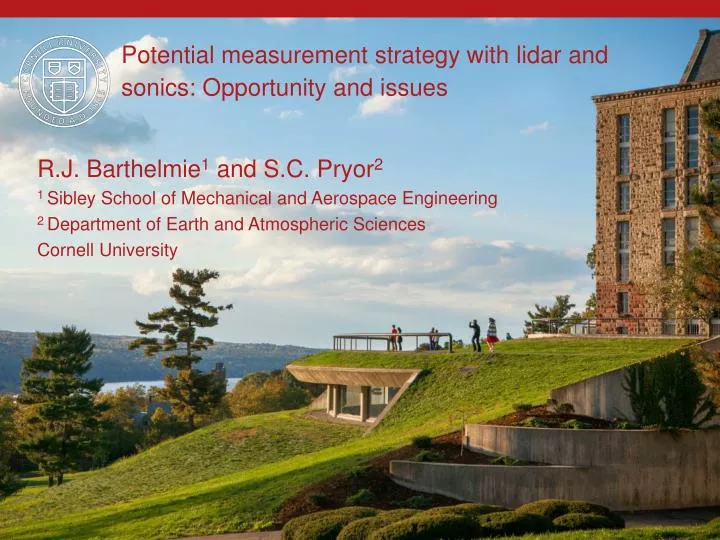
Potential measurement strategy with lidar and sonics : Opportunity and issues. R.J. Barthelmie 1 and S.C. Pryor 2 1 Sibley School of Mechanical and Aerospace Engineering 2 Department of Earth and Atmospheric Sciences Cornell University. Cornell people. Sara C Pryor

E N D
Potential measurement strategy with lidar and sonics: Opportunity and issues R.J. Barthelmie1and S.C. Pryor2 1 Sibley School of Mechanical and Aerospace Engineering 2 Department of Earth and Atmospheric Sciences Cornell University
Cornell people • Sara C Pryor • Specializing in fluxes, surface exchange • 20+ years of atmospheric measurements in forest, coastal and desert landscapes • Interest here: Fluxes, profiles and forest edges • Rebecca J Barthelmie • Specializing in wind resources & wakes • 20+ years of atmospheric measurement experience on- and offshore • Interest here: Variability of wind speed/turbulence profiles • + graduate students with measurement/modeling experience at NOAA, NREL, SgurrEnergy, 3EE
Challenges • Integrate data from (different) models and (different) measurements • Framing research questions – scale linkages/interactions
Instrumentation + example campaigns • Lots of measurements at Risoe/DTU/DMU • DoE funded flux measurements at MMSF (10 years+) • Long-term wake measurements at Indiana Wind Farm (2 years +) • Campaigns at Indiana wind farms (weeks), NREL (months), Lake Erie (weeks)
Instruments 1: Galion • Scanning pulse lidar • Scan geometries: VAD, PPI, RHI • ‘Output’ • Wind speed/direction profiles • Turbulence (‘staring mode’)/momentum flux (RHI) • Data processing • Uncertainty quantification & propagation as f(scan geometry, heterogeneity) • Optimization of scans (trade-off spatial sampling v. temporal ‘repetitions’) • Optimization of data screening QA/QC (SNR, weighted least squares, outlier detection, flow inhomogeneity assessment)
Instrument 2: ZephIR 320 • Continuous wave lidar • 10 measurement heights • Wind speed/direction profiles to 200 m • Vertical wind speed, “turbulence intensity”
Instrument 3: SpiDAR • Lower cost lidar • Made by Pentalum
Instrument 4: Sonics • Various Gill, Metek 3D sonics • Frequency up to 20 Hz • Turbulent wind components (u,v,w) • Derive heat and momentum fluxes
Data closure Barthelmie et al. 2014 BAMS
Example WRF plan • Double or triple nest simulations. • Outer domain at 12 km • Inner domain 4 km • Central domain at 1 km • 70 vertical levels • Output every 10 minutes • Objectives: • Optimizing WRF parameterizations/choices • PBL • Surface layer • Surface energy balance closure • Optimal resolution • Input datasets (e.g. LULC, SST, terrain) • WRF simulation & nesting
Research tasks • Instrument inter-comparison • Diagnosing measurement differences (physical or instrumental) • Short time scale – how to cross-calibrate, analyze and then measure • Direction offsets • Integration of model/measurements • Measuring vertical fluxes and profiles in complex terrain especially at forest edges • Specific research questions • (i) To what degree are wind and turbulence profiles through the heights relevant to wind energy ‘non-ideal’ relative to theoretical predictions made by invoking similarity theory (or derivatives thereof)? • (ii) Can the meandering component of wind turbine wake expansion be quantified and differentiated from diffusive expansion (with a specific focus on wake behavior in complex terrain)?