Download
1 / 15
150 likes | 290 Views
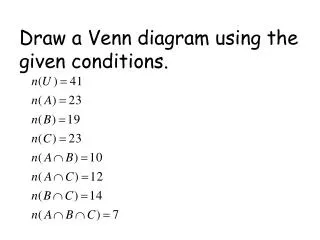
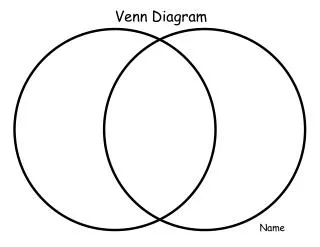
UNIT 4, LESSON 2 - Displaying Data using a Venn Diagram. 1/20/10. Mrs. Smith's homeroom class has 35 seniors in it. Using the diagram below answer the following questions. english. science. 1. How many are taking only science? 2. How many are taking English?

E N D
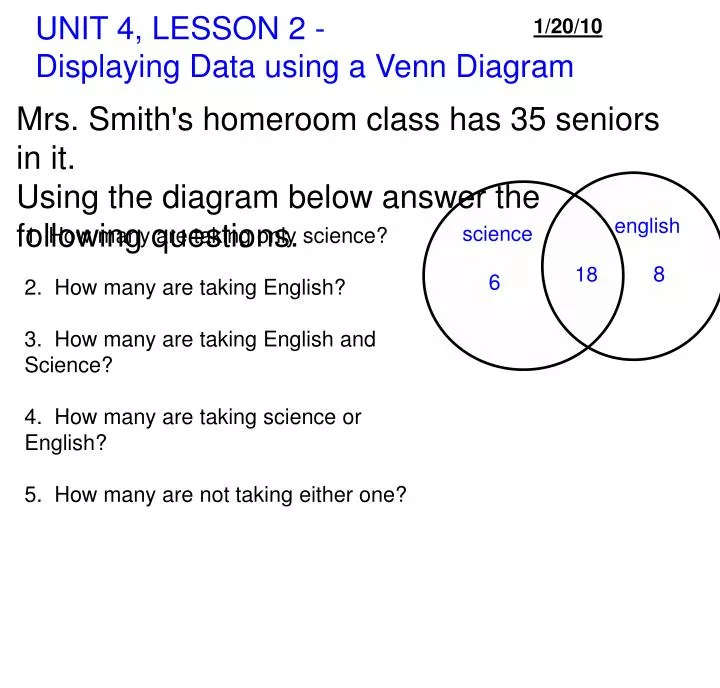
UNIT 4, LESSON 2 - Displaying Data using a Venn Diagram 1/20/10 Mrs. Smith's homeroom class has 35 seniors in it. Using the diagram below answer the following questions. english science 1. How many are taking only science? 2. How many are taking English? 3. How many are taking English and Science? 4. How many are taking science or English? 5. How many are not taking either one? 8 18 6
1/20/10 UNIT 4, LESSON 2 - Displaying Data using a Venn Diagram Types of sets: DISJOINT - no intersection INTERSECTING - Shared elements in a set SUBSETS - all elements are answers to a small set within a larger set EMPTY SET - no items are a solution in a set
When there are 2 sets of data the diagram looks like.... 4 groups: Set A Set B Set A and B Neither Set A Set B A∩B Neither
PRACTICE - use handout to help 1 1 1 2. Complete the diagram. met with friends ·10 students volunteered an hour yesterday in honor of the MLK holiday. ·14 students got together with friends. ·8 students did both. ·there are 20 total students volunteers
When there are 3 sets of data... there are 8 groups: Set A Set B Set C Set A and B Set B and C Set A and C Set A,B and C Neither Set A Set B A∩B A∩B∩C Set A∩C Set B∩C Set C
EXAMPLE: Consider this set of people who like ice Cream. Set C - those who like Chocolate Set S - those who like Strawberry Set V - those who like Vanilla c s 2 S only 50 C only Where should the following be placed? ·10 people who like Chocolate and Strawberry ·40 like Vanilla and Strawberry ·28 like Chocolate and Vanilla ·7 like all 3 flavors (hint: place this 1st) 121 V only v How many like Chocolate or Vanilla?
ADVANCED!!!!!! 2nd Example: Dogs with short tails Black dogs 24 dogs are in a kennel. 12 are Black. 6 have short tails. 15 have long hair. 3 short tail and long hair. 2 black with short tails. 1 black with short tail and long hair. Dogs with long hair If all dogs have at least one trait, how many dogs are black with long hair but not short tails?
PRACTICE and HOMEWORK: Complete the Venn Diagram worksheet #1-5 as CLASSWORK 6 & 7 as Homework. Also, for homework review your 6.1-6.3 quiz returned last week. There will be a requiz on Friday.