Download
1 / 8
80 likes | 186 Views
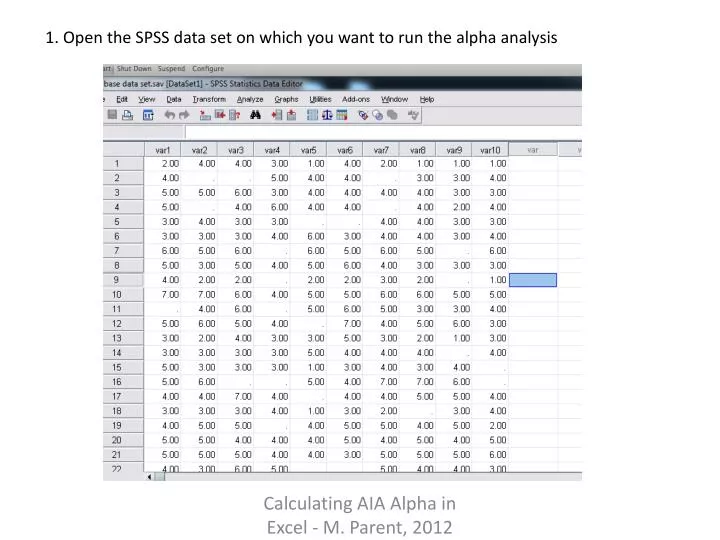
1. Open the SPSS data set on which you want to run the alpha analysis. 2. Request a correlation matrix of the items for which you want an alpha. Ask for cross-products and exclude data pairwise. 3. You’ll get a large table as output. 4. Copy and paste the table to excel.

E N D
1. Open the SPSS data set on which you want to run the alpha analysis Calculating AIA Alpha in Excel - M. Parent, 2012
2. Request a correlation matrix of the items for which you want an alpha. Ask for cross-products and exclude data pairwise. Calculating AIA Alpha in Excel - M. Parent, 2012
3. You’ll get a large table as output. Calculating AIA Alpha in Excel - M. Parent, 2012
4. Copy and paste the table to excel Calculating AIA Alpha in Excel - M. Parent, 2012
5. Delete the extra info—everything except the “covariance” line. Calculating AIA Alpha in Excel - M. Parent, 2012
6. Delete the bottom left triangle of the matrix (but keep the diagonal). Calculating AIA Alpha in Excel - M. Parent, 2012
7. Copy and paste the upper right triangle into the excel calculator Calculating AIA Alpha in Excel - M. Parent, 2012
8. Enter the number of variables into the calculator. Done! Calculating AIA Alpha in Excel - M. Parent, 2012