Download
1 / 31
310 likes | 319 Views
This text provides data on Brazil's carbon emissions, including historical trends, regional distribution, and the impact of deforestation. It also discusses Brazil's proposed emissions reduction targets and compares them to other countries.

E N D
Growth rate: 3.4% per year 9 8 CO2 emissions (PgC y-1) 2008: Emissions: 8.7 PgC Growth rate: 2.0% 1990 levels: +41% 2000-2008 Growth rate: 3.4% Growth rate: 1.0% per year 7 6 2000 2010 1990 Emissões Globais de Combustíveis Fósseis + Cimento 2007: 31.5 GtCO2 Fonte: Global Carbon Project
Regional Shift in Emissions Share Distribuição recente das emissões entre países desenvolvidos e em desenvolvimento 62% 57% 53% 49.7% 50.3% 43% 47% 38% Current Kyoto Protocol Enter into Force Percentage of Global Annual Emissions Kyoto Protocol Adopted FCCC Kyoto Reference Year Fonte: Global Carbon Project
2000 China 1600 USA 1200 Carbon (tons x 1000) 800 Russian Fed. 400 Japan India 0 03 07 99 03 05 1990 95 01 2007 Time Fossil Fuel Emissions: Top Emitters (>4% of Total) Global Carbon Project 2009; Data: Gregg Marland, CDIAC 2009
160 UK Canada Canada South Africa 120 Carbon (tons x 1000) Brazil 80 Australia Spain 40 Denmark 0 03 07 99 03 05 1990 95 01 2007 Time Fossil Fuel Emissions: Profile Examples (1-4% of Total) Global Carbon Project 2009; Data: Gregg Marland, CDIAC 2009
Distribuição histórica das emissões entre países desenvolvidos e em desenvolvimento Regional Share of Fossil Fuel Emissions 100% D3-Least Developed Countries 80% D2-Developing Countries 60% India 40% China FSU 20% D1-Developed Countries Japan EU 0% USA Cumulative Emissions [1751-2004] Flux in 2004 Population in 2004 Flux Growth in 2004 Fonte: Global Carbon Project
4 40% Oil 3 36% Coal CO2 emissions (PgC y-1) 2 Gas 1 Cement 0 2000 2010 1990 Components of FF Emissions Le Quéré et al. 2009, Nature-geoscience
Atmosfera 46% + Solos e Florestas 29% 31.5 Gt C02eq y-1 Oceanos 26% Destino das emissões antropogenicas de CO2(2000-2007) 5.5 Gt CO2eq y-1 Canadell et al. 2007, PNAS (updated)
Fossil Fuel Emissions: Actual vs. IPCC Scenarios Raupach et al. 2007, PNAS, updated; Le Quéré et al. 2009, Nature-geoscience; International Monetary Fund 2009
10 8 Fossil fuel 6 CO2 emissions (PgC y-1) 4 Land use change 2 1970 1980 2010 2000 1960 1990 CO2 Emissions from Land Use Change Le Quéré et al. 2009, Nature-geoscience; Data: CDIAC, FAO, Woods Hole Research Center 2009
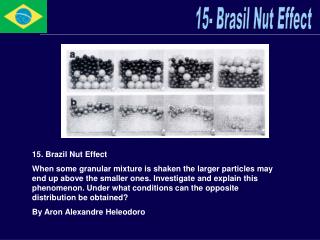
Colombia Cameroon Venezuela Nicaragua Peru Rep.Dem.Congo India Nigeria Philippines Nepal 4-2% <1% 2-1% Net CO2 Emissions from LUC in Tropical Countries 2000-2005 600 60% 500 Brazil 400 Indonesia CO2 emissions (TgC y-1) 300 200 100 0 RA Houghton 2009, unpublished; Based on FAO land use change statistics
(Area) Emissions from Land Use Change (2000-2005) Canadell et al. 2009, Biogeosciences
Fire Emissions from deforestation zones (TgC y-1) Fire Emissions from Deforestation Zones Global Fire Emissions Dataset (vs2) van der Werf et al. 2006, Atmospheric Chemistry and Physics, updated
Carbon Emissions from Land Use Change Tropical deforestation 13 Million hectares each year Borneo, Courtesy: Viktor Boehm 2000-2007 Tropical Americas 0.6 Pg C y-1 Tropical Asia 0.6 Pg C y-1 Tropical Africa 0.3 Pg C y-1 1.5 Pg C y-1 [2007-Total Anthropogenic Emissions:8.5+1.5 = 10 Pg] Canadell et al. 2007, PNAS; FAO-Global Resources Assessment 2005
October 21 2007 Charles launches campaign to save ravaged rainforests Prince Charles will this week join the battle against climate change by launching an organisation which calls for a new green economics that recognises the world's rainforests are worth more alive than dead. Deforestation is responsible for 18-25 per cent of global carbon emissions, an output second only to energy production.
Deforestation is responsible for 18-25 per cent of global carbon emissions (Prince Charles) How does anyone know? Source: Carlos Nobre (INPE)
The impact of deforestation Deforestation is responsible for 20% of global carbon emissions (Sir David King) How does he know?
The impact of deforestation Brazil (1990s): 22.000 km2 average - about 3% of CO2 emissions Brazil (2005-2010 est): 12.000 km2 - about 1,2% of CO2 emissions
Redução do desmatamento Valores anuais de queda do desmatamento para atingir redução de 80% em 2020
Impact of Brazilian contribution to global emissions mitigation: most likely scenario USA proposed legislation commits to a 17% cut in emissions relative to 2005. USA Brazilian proposal will reduce emissions 36% to 39% in relation to BAU by 2020 Brazil Proposed Brazilian reduction 1,1 Gt CO2eq Proposed US reduction (Boxer-Kerry law) 1,23 Gt CO2eq
Impact of Brazilian contribution to global emissions mitigation: best case scenario Brazilian proposed emissions cut would be 40% of best-case US reduction G77 has demanded a a 40% cut in US emissions relative to 1990 levels. USA Brazil Proposed Brazilian reduction 1,1 Gt CO2eq G77 requested US reduction of 2,5 Gt CO2eq