Download
1 / 81
810 likes | 1k Views
The Global Economy Introduction. Roadmap. Weekly discussion Trends Trade in goods and services Fluctuations Inflation and output Course information. Weekly discussion. First 10-15 minutes of class Focus on topic from Bb discussion More on this later A hook into current events

E N D
Roadmap • Weekly discussion • Trends • Trade in goods and services • Fluctuations • Inflation and output • Course information
Weekly discussion • First 10-15 minutes of class • Focus on topic from Bb discussion • More on this later • A hook into current events • Be reading! (The Economist, FT, …) • Interesting articles, anecdotes?
FOMC Statement (9/13/12) • “To support a stronger economic recovery … the Committee agreed today to increase policy accommodation by purchasing additional agency MBS at a pace of $40 billion per month.” • “If the outlook for the labor market does not improve substantially, the Committee … will undertake additional asset purchases … until such improvement is achieved in a context of price stability. • “The Committee … currently anticipates that exceptionally low levels for the federal funds rate are likely to be warranted at least through mid-2015.” • Why such an aggressive policy?
Class participation • A part of class • I expect everyone to participate: expect cold calls • Answer a question • Make a comment • Share an experience • Post to Bb discussion • Broad range of backgrounds • Expert: keep it short • Non-expert: don’t panic
Roadmap • Weekly discussion • Trends • Trade in goods and services • Fluctuations • Inflation and output • Course information
Long-Run Performance Production, Saving &Investment, Productivity, Institutions, Capital & Labor Markets, International Trade First half: Short-Run Performance Inflation, Economic Indicators, Aggregate Supply & Demand, Monetary Policy, Taxes & Deficits, Exchange Rates, Capital Flows, Emerging Market Crises Second half: The big picture
Long run: GDP per capita Source: Penn World Tables 7.0.
The wealth of nations • U.S. GDP/capita > 100 x Burundi GDP/capita • What explains these differences?
Long-run economic growthGDP per capita in Year 2000 international dollars Source: Maddison, 2001; 2008 estimate based on Maddison tables.
Trends are important Source: Maddison, “Historical Statistics for the World Economy”
Do institutions matter? U.S. India Note: Size of circle is proportional to population. Data sources: World Bank and Transparency International.
Do institutions matter? U.S. China Note: Size of circle is proportional to population. Data sources: World Bank and Heritage Foundation.
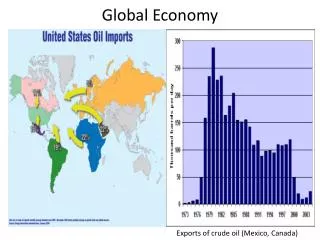
How do trade patterns evolve? • Who are the U.S.’s largest trade partners? • What good is most traded? (value-wise) • How are trade patterns changing? • Why are they changing?
US imports Canada Japan Mexico China
US exports Canada Mexico Japan China
About the course • Main data sources • Blackboard • Syllabus: on Bb • Announcements: on Bb • Course by session: on Bb
About me • Originally from Madison, WI • PhD in Economics, U. Minnesota • Previous: U. Texas-Austin, Minneapolis FED • Research interests: • International trade policy • Firm level export decisions • Emerging market crises • Other interests: • Computers, running, beer
About the teaching assistant • M: Saahil Sajnani • sps362@stern.nyu.edu • T: Deger Atay • da1188@stern.nyu.edu • W: Jasper Cooper • jc3850@stern.nyu.edu
About class notes • No textbook! • Theoretical background to class discussion • Executive summaries: more concise than a textbook • Custom designed for this course • Read them – preferably before class • Entire PDF is available for download from Bb • Perfect for phone, tablet, etc.
About assignments 5 problem sets PS #0: individual problem set PS #1-4: group work is fine You chose the group No more than 5 to a group Group of 1 is fine Drop lowest score, average the rest Submit via Bb dropbox
About assignments Weekly discussion board A way to Participate Keep up on current issues Once during the semester, you will post a “lead” comment Details in handout
About help! Problem set help Post to discussion board, I will answer there Other help Send me an email Stop by See the teaching assistant
About helping me • Course works best if communication goes both ways • If you have ideas, comments, questions, whatever: • Send an email • Speak to the teaching assistant • Post on the discussion board
Summary As Haiku: read notes before class if you need help ask for it Blackboard is knowledge
Roadmap • FRED • Headline Data • Gross Domestic Product (GDP) • Inflation • How are they measured? • What are the basic facts? • Why care about GDP?
Your friend FRED • Federal Reserve Economic Database (FRED) • Basic tutorials • Mobile apps • Excel add-ins for Windows and Mac • Basic graph: Enter code in FRED search box • Edit graph to change dates, frequency, appearance, units, etc. • PDF of graph for homework • Download data into Excel spreadsheet
FRED data in Excel • Start at FRED home page • Graph the first data series that you wish to download • Click “Edit Graph” • (1) Adjust the date range, frequency, units • (2) Click “Add data series” • (3) Enter new data code in the search box, repeat step 1 and click “Redraw Graph” • (4) Repeat steps (1) to (3) until the series are all graphed • Click “Download Data in Graph” • Save the Excel file for further analysis of data
Why worry about measurement? • Need a common vocabulary • Small changes in definition make big differences • Accurate forecasting requires consistent measurements
GDP per capita (PPP adj, 2006 USD) Source: PWT 7.0
Growth of GDP per capita (forecast for 2013) Source: OECD Economic Outlook, April 2012.