Download
1 / 12
120 likes | 135 Views
Learn how TVA manages a 40,000 sq. mile region encompassing states like TN and GA for multipurpose objectives such as power generation and navigation using RiverWare. Optimize hydropower using economic objective functions and block cost data for scheduling.

E N D
Scheduling the TVA Hydro System Using RiverWare’s Optimization Suzanne H. Biddle, P.E. Tennessee Valley Authority
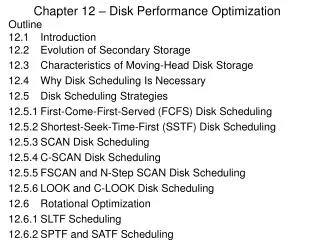
TVA region covers 40,000 sq miles KY VA NASHVILLE NC KNOXVILLE TN CHATTANOOGA HL SC MS GA AL Watershed Power Service Area
Average annual rainfall above Chattanooga is about 51 inches and runoff is about 22 inches
TVA operates the reservoir system to meet multipurpose objectives • Navigation • Flood damage reduction • Power generation • Recreation • Water quality • Water supply
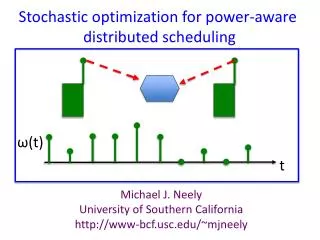
River Scheduling issues two hydro forecasts each day Inputs Future value of water Hourly hydropower value Inflow forecast Initial conditions Objectives 9 day optimization using marginal costs for water allocation 9 day optimization using block costs for daily generation schedule 3 day optimization using block costs for hourly generation schedule daily hydro forecast (14 days) hourly generation preschedule (current day + 2 forecast days)
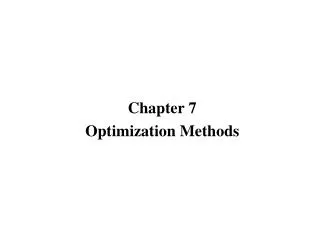
RiverWare Hourly Preschedule 2 Days Optimization covers short term, but also considers long term tradeoff Future Value of Water 14 - 120 Days RiverWare 6-Hourly Forecast 14 Days Observed Values 3 - 14 Days Current Day
These objectives are used in optimizing the hydro system • Day 1 outflows are fixed • Ending targets are fixed for non-storage tributaries and main river • Minimum flow requirements • Top and bottom of daily operating zone – non-storage tribs and main river only • Minimum operations guides • Flood guides • Minimize spill • Special operations • Economic objective function
What does “economic objective function” mean? • All operating constraints must first be satisfied • Then, with any remaining flexibility: • Maximize avoided operating cost + delta (value of water in storage)
After water is allocated, block cost data is used to determine which hours to run
The reservoir system is modeled as a whole for hydropower optimization