Download
1 / 11
120 likes | 231 Views
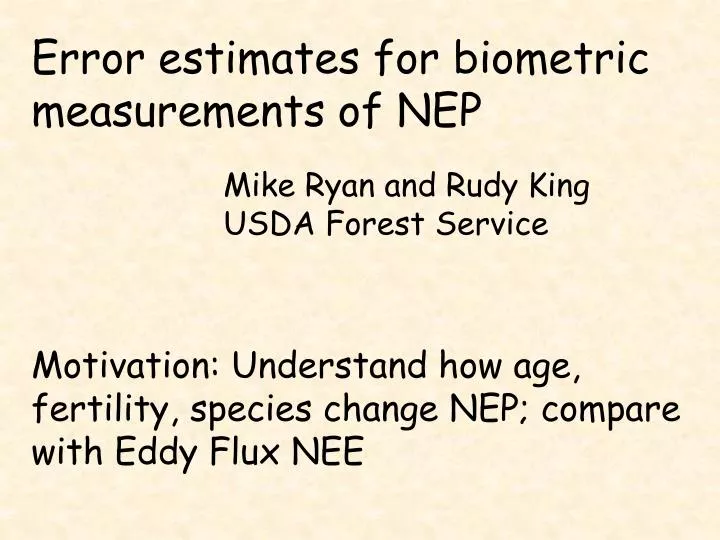
Error estimates for biometric measurements of NEP. Mike Ryan and Rudy King USDA Forest Service. Motivation: Understand how age, fertility, species change NEP; compare with Eddy Flux NEE. One Method of Estimating NEP from Biometric Measurements. NEP = GPP – R H - R A.

E N D
Error estimates for biometric measurements of NEP Mike Ryan and Rudy King USDA Forest Service Motivation: Understand how age, fertility, species change NEP; compare with Eddy Flux NEE
One Method of Estimating NEP from Biometric Measurements NEP = GPP – RH - RA = Annual change in ecosystem C storage = [CDW (dead wood) + CW (live biomass)+ CS (soil) + CR (Roots) + CL (fine litter)]
Myths • Variability is too large to do this accurately • Compounding error will give very uncertain estimates of NEP • However, most variability is local (scale of m2) and not important for our questions (scale of ha or larger)
Two Cases • Replicate Plots: Inference at a landscape or experiment scale • Single site: Inference at a site scale (for example Ameriflux tower footprint)
Replicate Plots • Sub-sample variance not included in replicate plot is negligible and does not have to be propagated (n/N ~ 0): • Poor sub-sampling will give larger variance among replicate plots, and good sub-sampling will give smaller variance among replicate plots, but you do not need to propagate any additional sub-sample variance.
Replicate Plots • Cumulative Error: NEP calculated using plot-level estimates of all components contains cumulative (S variance + covariance) and sub-sample variance. • Allometric equations? Working on it.
Results • For Eucalypt plantation in Hawaii: CV for NEP ~40%. 95% CI = 20 – 30% of mean for n=6. Larger plots for biomass sampling would probably lower CV. • 50% higher NEP in high fertility plots
Results • CV for lodgepole pine chronosequence suggests similar variance for NEP: Biomass C 12-20% Dead Wood C 17-45% Forest Floor C 8-12% Soil C 5-25%
Single Site • CI and SE will decrease with sqrt(sample size). • Plots (with sub-sampling) can be used to minimize small-scale variability. • Cumulative Error: NEP calculated using plot-level estimates of all components contains cumulative (S variance + covariance) and sub-sample variance.
What can improve precision? • Replicate sample units • Time (Precision of D increases linearly with number of years) • Increased subsamples/replicate plot will decrease overall variance--especially important with small n.
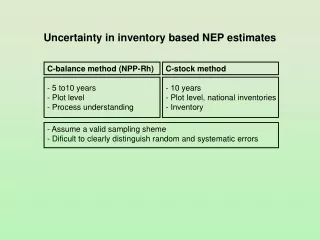
Needs for Ameriflux • Commitment to measuring C stocks at all sites • Commitment to measuring NEP based on changes in C stocks over some standard interval (5-10 years). • Development of standard methodology for measuring C stocks and changes at sites. • Research into efficient sampling methods.