Download
1 / 16
160 likes | 338 Views
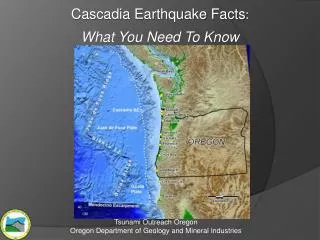
Cascadia GPS Analysis Extension Activity: PBO “Locked and Loading”. Activity modeled after work by Bob Butler at University of Portland Using scaffolding from Cascadia GPS Analysis Analyze plate deformation in our backyard Can update data to the day. “Locked and Loading” Procedure.

E N D
Cascadia GPS Analysis Extension Activity:PBO “Locked and Loading” • Activity modeled after work by Bob Butler at University of Portland • Using scaffolding from Cascadia GPS Analysis • Analyze plate deformation in our backyard • Can update data to the day
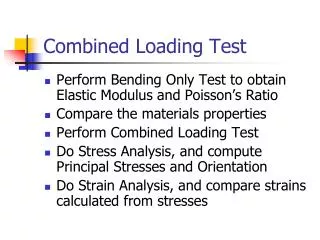
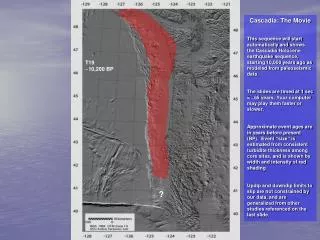
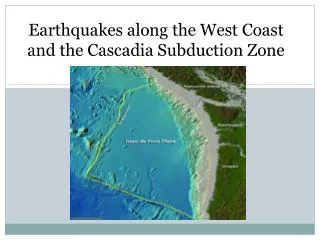
“Locked and Loading” Procedure • Objective is to show a more complete picture of deformation of western margin of North American Plate • Groups work to calculate station movement in ‘bins’ • One coastal station • One urban corridor station • One east of the Cascades station • Use Cascadia GPS Analysis Grid to plot movement of 3 stations • Compare with other groups to look for patterns
Neah Bay Pacific Beach Tumwater Othello • Kelso Tillamook Wasco La Grande Newport Corvallis Coastal Stations Urban Corridor Stations East of the Cascades Stations PBO Locked and Loading
Don’t use Height - too messy Example of Time Series Plot
Station NEAH Neah Bay, WA GPS Time Series Plot - with trend lines
Neah Bay, WA GPS Data 2004 2004 2005 2005 2006 2006 2007 2007 2008 2008 2009 2009
42 mm / 5.5 yr = 7.6 mm/yr 56mm / 5.5 yr = 10.2 mm/yr Neah Bay, WA GPS Data 2004 2005 2006 2007 2008 2009
12.4 mm / yr Neah Bay, WA GPS Velocity
Tumwater, WA GPS Data 2004 2005 2006 2007 2008 2009
28 mm / 5.5 yr = 5.1 mm/yr 26 mm / 5.5 yr = 4.7 mm/yr Tumwater, WA GPS Data 2004 2005 2006 2007 2008 2009
7.0 mm / yr Tumwater, WA GPS Velocity
Othello, WA GPS Data 2005 2006 2007 2008 2009
6 mm / 4.5 yr = 1.3 mm/yr 0 mm / 4.5 yr = 0.0 mm/yr Othello, WA GPS Data 2005 2006 2007 2008 2009
1.3 mm / yr Othello, WA GPS Velocity
Urban Corridor Stations Coastal stations East of Cascades Stations
Neah Bay Pacific Beach Tumwater Othello Kelso Tillamook Wasco La Grande Newport Corvallis GPS velocities