Download
1 / 55
580 likes | 980 Views
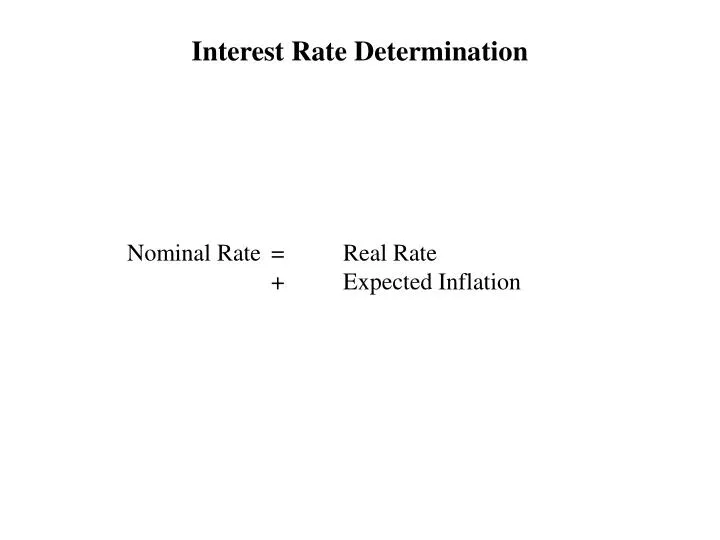
Interest Rate Determination. Nominal Rate = Real Rate + Expected Inflation. The Risk and Term Structures of Interest Rates. Risk structure : Bonds with the same maturity ( n ) have different interest rates because of default risk premium ( d ) illiquidity risk premium ( l )

E N D
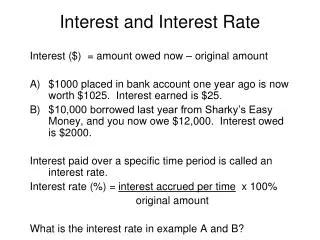
Interest Rate Determination • Nominal Rate = Real Rate • + Expected Inflation
The Risk and Term Structures of Interest Rates • Risk structure: Bonds with the same maturity (n) have different interest rates because of • default risk premium (d) • illiquidity risk premium (l) • income tax risk discount (t) • Term structure: For bonds with identical characteristics, the interest rate (i) increases as maturity (n) increases • maturity premium (int – it) • liquidity premium (lnt) • The yield curve is the relationship between i and n.
Risk Structure Default risk premium Default risk is the probability that the issuer of the bond is unable or unwilling to make interest payments or pay off the face value U.S. Treasury bonds are considered default free Default risk premium(d) is the spread between the interest rates on bonds with default risk and the interest rates on Treasury bonds, holding l, t, n, lnt, and int– it equal
Risk Structure Default risk premium P i P i Sc St 950 5 950 5 Dt Dc Q Q Corporate Bond Market U.S. Treasury Bond Market
Risk Structure Default risk premium P i P i Sc St 950 5 950 5 925 6 Dt Dc Dc Q Q Corporate Bond Market U.S. Treasury Bond Market
Risk Structure Default risk premium P i P i Sc St 4 975 950 5 950 5 925 6 Dt Dt Dc Dc Q Q Corporate Bond Market U.S. Treasury Bond Market
Risk Structure Default risk premium P i P i Sc St 4 975 2 925 6 Dt Dt Dc Dc Q Q Corporate Bond Market U.S. Treasury Bond Market
Risk Structure Default risk premium You own a $1000, 10% GM bond that matures next year. The Obama Administration abrogated 100 years of bankruptcy law when it stripped primary bond holders of their first claim rights on corporate assets during the GM bailout. Explain why corporate bond prices would be lower in the post bailout era, holding all else equal. If the GM bond sold for $1068 before the bailout but sells for $1023, compute the yields on the bonds before and after the bailout. Post-bailout N = 1 I% = A PV = -1023 PMT = 100 FV = 1000 Pre-bailout N = 1 I% = A PV = -1068 PMT = 100 FV = 1000
Risk Structure Default risk premium You own a $1000, 10% GM bond that matures next year. The Obama Administration abrogated 100 years of bankruptcy law when it stripped primary bond holders of their first claim rights on corporate assets during the GM bailout. Explain why corporate bond prices would be lower in the post bailout era, holding all else equal. If the GM bond sold for $1068 before the bailout but sells for $1023, compute the yields on the bonds before and after the bailout. Post-bailout N = 1 I% = 7.527 PV = -1023 PMT = 100 FV = 1000
Liquidity is the relative ease with which an asset can be converted into cash Cost of selling a bond Number of buyers/sellers in a bond market Illiquidity risk premium (l) is the spread between the interest rate on a bond that is illiquid and the interest rate on Treasury bonds, holding d, t, n, lnt, and int – it equal. E.g., assume an investor is looking at buying two corporate bonds that have the same coupon rates and maturities, but only one is traded on a public exchange. The investor is not be willing to pay as much for the non-public bond. The difference in yields the investor is willing to pay for each bond is the liquidity premium. Risk Structure Illiquidity risk premium
Risk Structure Illiquidity risk premium P i P i Sc St 950 5 950 5 Dt Dc Q Q Corporate Bond Market U.S. Treasury Bond Market
Risk Structure Illiquidity risk premium P i P i Sc St 950 5 950 5 925 6 Dt Dc Dc Q Q Corporate Bond Market U.S. Treasury Bond Market
Risk Structure Illiquidity risk premium P i P i Sc St 4 975 950 5 950 5 925 6 Dt Dt Dc Dc Q Q Corporate Bond Market U.S. Treasury Bond Market
Risk Structure Illiquidity risk premium P i P i Sc St 4 975 2 925 6 Dt Dt Dc Dc Q Q Corporate Bond Market U.S. Treasury Bond Market
Risk Structure Illiquidity risk premium You are considering owning two $1000 bonds that mature next year. One is a corporate bond, the other is a Treasury, and both have an 8% coupon rate. Explain why the Treasury is selling for $1058 while the corporate bond is selling for $1001 if both have the same bond rating, and compute the yields on the two bonds. Corporate N = 1 I% = A PV = -1001 PMT = 80 FV = 1000
Risk Structure Illiquidity risk premium You are considering owning two $1000 bonds that mature next year. One is a corporate bond, the other is a Treasury, and both have an 8% coupon rate. Explain why the Treasury is selling for $1058 while the corporate bond is selling for $1001 if both have the same bond rating, and compute the yields on the two bonds. Corporate N = 1 I% = 7.892 PV = -1001 PMT = 80 FV = 1000 Treasury N = 1 I% = 2.079 PV = -1058 PMT = 80 FV = 1000
Income tax considerations Interest payments on municipal bonds are exempt from federal income taxes. Tax exemption risk discount (t) is the spread between the interest rate on a tax exempt municipal bond and the interest rate on Treasury bonds, holding d, l, n, lnt, and int– itequal. The discount shrinks if federal income taxes are lowered or there is talk of doing so politicians seriously consider ending the exemption the exemption is repealed. Risk Structure Tax exemption risk discount
Risk Structure Tax exemption risk discount P i P i St Sc 950 5 950 5 Dt Dc Q Q Municipal Bond Market U.S. Treasury Bond Market
Risk Structure Tax exemption risk discount P i P i St Sc 950 5 950 5 925 6 Dt Dc Dc Q Q Municipal Bond Market U.S. Treasury Bond Market
Risk Structure Tax exemption risk discount P i P i St Sc 4 975 950 5 950 5 925 6 Dt Dt Dc Dc Q Q Municipal Bond Market U.S. Treasury Bond Market
Risk Structure Tax exemption risk discount P i P i St Sc 4 975 -2 925 6 Dt Dt Dc Dc Q Q Municipal Bond Market U.S. Treasury Bond Market
Risk Structure Tax exemption risk discount You are considering owning two $1000 bonds that mature next year. One is a corporate bond, the other is a tax-free municipal, and both have an 8% coupon rate. If the bonds have a current yield of 3.5%, and you intend to hold them for their final year, compute the price you would be willing to pay assuming a federal income tax rate is 50%. Corporate N = 1 I% = 3.5 PV = A PMT = 40 FV = 1000
Risk Structure Tax exemption risk discount You are considering owning two $1000 bonds that mature next year. One is a corporate bond, the other is a tax-free municipal, and both have an 8% coupon rate. If the bonds have a current yield of 3.5%, and you intend to hold them for their final year, compute the price you would be willing to pay assuming a federal income tax rate is 50%. Corporate N = 1 I% = 3.5 PV = -1004.83 PMT = 40 FV = 1000 Tax-free municipal N = 1 I% = 3.5 PV = -1043.48 PMT = 80 FV = 1000
Risk Structure Figure 1—Long-Term Bond Yields, 1919–2011 Sources: Board of Governors of the Federal Reserve System, Banking and Monetary Statistics, 1941–1970; Federal Reserve; www.federalreserve.gov/releases/h15/data.htm.
Interest Rate Determination • Nominal Rate = Real Rate • + Expected Inflation • + Default Risk Premium • + Illiquidity Risk Premium • – Tax exemption discount
Term Structure • Time to maturity affects interest rates because • Time increases exposure to risk, causing investors to demand higher yields on securities with longer maturities. • The term structure of interest rates refers to difference in the yields on instruments that are identical except for term to maturity. • Term structure is represented graphically by a yield curve. • Yield curves consider only the relationship between maturity or term of a security and its yield at a moment in time, otrs.
Facts that the theory must explain: Interest rates on bonds of different maturities move together over time Term Structure
Term Structure Figure 4—Interest rate movements on Treasuries with different maturities Sources: Federal Reserve; www.federalreserve.gov/releases/h15/data.htm.
Facts that the theory must explain: Interest rates on bonds of different maturities move together over time When short-term interest rates are low, yield curves are more likely to have an upward slope; when short-term rates are high, yield curves are more likely to slope downward and be inverted Yield curves almost always slope upward Term Structure
Term Structure February 4, 2005
Term Structure Figure 7 Yield Curves for U.S. Government Bonds
Term Structure Figure 6
Facts that the theory must explain: Interest rates on bonds of different maturities move together over time When short-term interest rates are low, yield curves are more likely to have an upward slope; when short-term rates are high, yield curves are more likely to slope downward and be inverted Yield curves almost always slope upward Term Structure Three Theories that explain these facts • Segmented markets theory explains fact three but not the first two • Expectations theory explains the first two facts but not the third • Liquidity premium theory combines the two theories to explain all three facts
Term Structurematurity premium • Expectations theory says the yield on a long-term bond equals the average of the short-term interest rates people expect to occur over its life • Maturity Premiumis the spread between the interest rates on bonds with n years and 1year to maturity, holding d, l, t, and lntequal. int– it • Buyers of bonds • do not prefer bonds of one maturity over another • do not hold any quantity of a bond if its expected return is less than that of another bond with a different maturity • consider bonds with different maturities to be perfect substitute
Term Structurematurity premium The table below shows current and expected future one-year interest rates, as well as current interest rates on multiyear bonds. Use the table to calculate the liquidity premium for each multiyear bond.
Term Structurematurity premium The table below shows current and expected future one-year interest rates, as well as current interest rates on multiyear bonds. Use the table to calculate the liquidity premium for each multiyear bond.
Term Structurematurity premium The table below shows current and expected future one-year interest rates, as well as current interest rates on multiyear bonds. Use the table to calculate the liquidity premium for each multiyear bond.
Term Structurematurity premium The table below shows current and expected future one-year interest rates, as well as current interest rates on multiyear bonds. Use the table to calculate the liquidity premium for each multiyear bond.
Term Structurematurity premium The table below shows current and expected future one-year interest rates, as well as current interest rates on multiyear bonds. Use the table to calculate the liquidity premium for each multiyear bond.
Term Structurematurity premium The table below shows current and expected future one-year interest rates, as well as current interest rates on multiyear bonds. Use the table to calculate the liquidity premium for each multiyear bond.
Term Structurematurity premium The table below shows current and expected future one-year interest rates, as well as current interest rates on multiyear bonds. Use the table to calculate the liquidity premium for each multiyear bond.
Term Structurematurity premium Graph the maturity adjusted yields over maturity i n
Term Structurematurity premium Graph the maturity adjusted yields over maturity i n maturity premium for a 1-year bond 0%
Term Structurematurity premium Graph the maturity adjusted yields over maturity i n maturity premium for a 2-year bond 0.325%
Term Structurematurity premium Graph the maturity adjusted yields over maturity i n maturity premium for a 3-year bond 0.57%
Term Structurematurity premium Graph the maturity adjusted yields over maturity i n maturity premium for a 4-year bond 0.7675%
Term Structurematurity premium Graph the maturity adjusted yields over maturity i n maturity premium for a 5-year bond 0.93%
Term Structurematurity premium Graph the maturity adjusted yields over maturity i n maturity premium for a 6-year bond 1.06%
Term StructureExpectations Theory Yield Curve i n