Download
1 / 7
70 likes | 82 Views
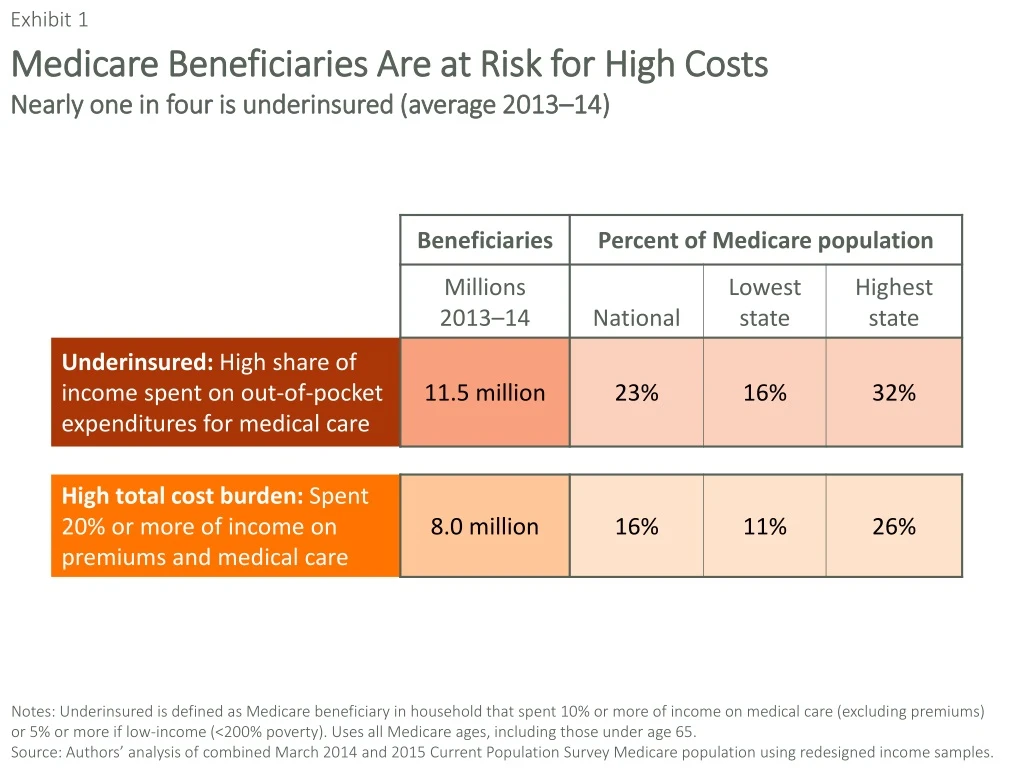
This exhibit highlights the financial challenges faced by Medicare beneficiaries, with one in four considered underinsured based on income spent on medical care. Low-income beneficiaries are at the highest risk of high total cost burden, with significant percentages in various states. The distribution of average out-of-pocket spending by beneficiaries on covered and non-covered services is also explored. The data reveals that a considerable portion of adults age 65 or older would be classified as poor or near-poor if medical out-of-pocket expenses were included. The findings emphasize the financial vulnerability of certain Medicare populations and the need for policy considerations to address these challenges effectively.

E N D
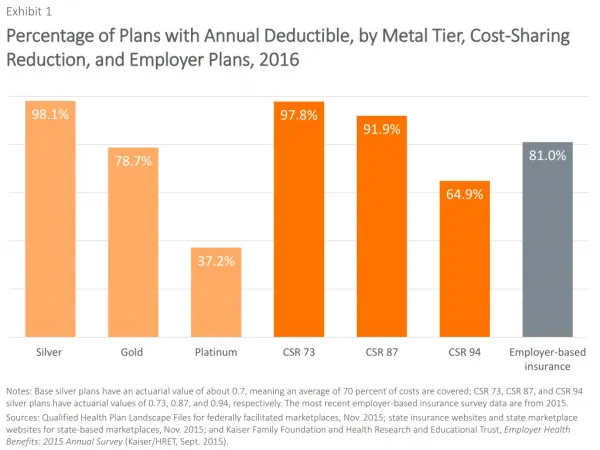
Exhibit 1 Medicare Beneficiaries Are at Risk for High CostsNearly one in four is underinsured (average 2013–14) Notes: Underinsured is defined as Medicare beneficiary in household that spent 10% or more of income on medical care (excluding premiums) or 5% or more if low-income (<200% poverty). Uses all Medicare ages, including those under age 65. Source: Authors’ analysis of combined March 2014 and 2015 Current Population Survey Medicare population using redesigned income samples.
Exhibit 2 Medicare’s Low-Income Beneficiaries Are at Highest Risk Percent of Medicare beneficiaries (2013–14) who . . . Notes: Underinsured is defined as Medicare beneficiary in household that spent 10% or more of income on medical care (excluding premiums) or 5% or more if low-income (<200% poverty). High total cost burden is defined as 20% or more of income spent on premiums and medical care.Source: Authors’ analysis of combined March 2014 and 2015 Current Population Survey Medicare population using redesigned income samples.
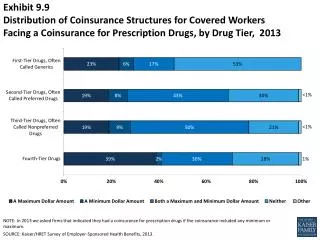
Exhibit 3 Distribution of Average Out-of-Pocket Spending by Medicare Beneficiaries on Covered and Noncovered Services Hospital Physicians Prescription drugs Other services Home health care Long-term care facility Dental care COVERED All Medicarebeneficiaries, 2010 Community-dwelling Medicare beneficiaries, 2010* NONCOVERED * Community-dwelling = those beneficiaries not living in nursing homes. Source: Authors’ analysis of 2010 Medicare Current Beneficiary Survey.
Exhibit 4 Underinsured Medicare Beneficiaries by StateRanges from 16 percent to 32 percent of state Medicare population Percent of Medicare beneficiaries who are underinsured for medical care, 2013–14 National average 23% Notes: Asterisk indicates the state’s underinsured percentage is significantly different from the national average at p<.05. Underinsured is defined as Medicare beneficiary in household that spent 10% or more of income on medical care (excluding premiums) or 5% or more if low-income (<200% poverty).Source: Authors’ analysis of combined March 2014 and 2015 Current Population Survey Medicare population using redesigned income samples.
Exhibit 5 Medicare Beneficiaries with High Total Cost Burden by StateRanges from 11 percent to 26 percent of state Medicare population Percent of Medicare beneficiaries who spent 20 percent or more of income on premiums and medical care, 2013–14 National average 16% Notes: Asterisk indicates the state’s percentage with a high total cost burden is significantly different from the national average at p<.05. High total cost burden is defined as Medicare beneficiary in household that spent 20% or more of income on premiums and medical care.Source: Authors’ analysis of combined March 2014 and 2015 Current Population Survey Medicare population using redesigned income samples.
Exhibit 6 Low-Income Underinsured Medicare Beneficiaries by StateRanges from 29 percent to 58 percent of state Medicare population Percent of low-income Medicare beneficiaries who are underinsured for medical care, 2013–14 National average 41% Notes: Asterisk indicates the state’s percentage of low-income underinsured Medicare beneficiaries is significantly different from the national average at p<.05. Underinsured is defined as Medicare beneficiary in household that spent 10% or more of income on medical care (excluding premiums) or 5% or more if low-income (<200% poverty). Twelve states with small sample sizes are excluded from the analysis.Source: Authors’ analysis of combined March 2014 and 2015 Current Population Survey Medicare population using redesigned income samples.
Exhibit 7 More Adults Age 65 or Older Would Be Poor or Near-Poor if Medical Out-of-Pocket Expenses Were Counted Percent of adults age 65 or older who are poor or near-poor <200% poverty total = 43 <200% poverty total = 32 Note: Supplemental poverty includes out-of-pocket spending on medical care; official poverty does not. Source: K. Short, “The Supplemental Poverty Measure: 2014,” Current Population Reports, P60-254 (U.S. Census Bureau, Sept. 2015).