Download
1 / 19
190 likes | 320 Views
Atmospheric Circulation Structures Associated with Freezing Rain in Quebec City, QC, and the St-Lawrence River Valley. Sophie Splawinski, Hon. BSc. Atmospheric and Oceanic Sciences McGill University, Montreal, Quebec, Canada Contact: sophie.splawinski@mail.mcgill.ca

E N D
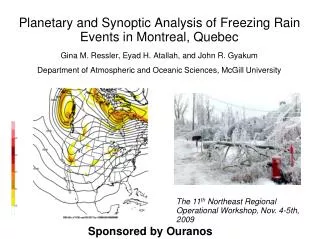
Atmospheric Circulation Structures Associated with Freezing Rain in Quebec City, QC, and the St-Lawrence River Valley Sophie Splawinski, Hon. BSc. Atmospheric and Oceanic Sciences McGill University, Montreal, Quebec, Canada Contact: sophie.splawinski@mail.mcgill.ca Co-Authors: Prof. John R. Gyakum, Dr. Eyad H. Atallah
Introduction • An analysis of freezing rain (FZRA) over a 30-year period in Quebec City, QC. • Severe events: partitioned into categories and shown to have distinct synoptic patterns. • Composites • Result: unique thermodynamic and dynamic signatures associated with each category.
Motivation FZRA Occurrences over an 11-yr period (1979-1990) • Freezing rain (FZRA) effects on the general population • Past Studies conducted in Eastern Canada: none associated with synoptic weather patterns Courtesy of PSU Dept. of Meteorology • Location of the St-Lawrence River Valley (SLRV) and effects of the valley • Pressure-driven channeling • countercurrents
Approach and Data • A 30-year period (1979-2008) is analyzed • YQB hourly surface obs • Individual Events • 218 cases • Duration: time ≥ 1hr • A new event would be considered after 6hrs+ of consecutive non-FZRA reports. • Severe Events • 48 cases • Duration: time ≥ 6hr • A new event would be considered after 6hrs+ of consecutive non-FZRA reports.
Data and Tools Data: • Hourly surface observations at YQB • NARR Tools: • GEMPAK • ARL Hysplit trajectory model
Partitioning Technique • Why were air parcel trajectories chosen as a method for categorization? • Dynamic versus Instantaneous Approach • Level: 3000m, nominal level associated with vertical motion • Also gave the best results
Partitioning Technique: The Categories Mid Level Category Example n = 19 Low Level Category Example n = 14
Partitioning Technique: The Categories East Coast Category Example n = 5 Upper Level Category Example n = 5
Partitioning Technique: The Categories Central Plains Category: Example n = 5 • Recap of all categories: • 3000m height chosen. • Based on specific layers at which air parcels begin their trajectories (t=-84h) • 2º-by-2º matrix grid with 24 grid points and hence 24 trajectories
Composites • 5 composite plots of the following: • 500 hPa height and temperature • MSLP, winds and 1000-500 hPa thickness • 850 hPa winds • Precipitable water • 850 hPa temperature
Low Level (n = 14) Mid Level (n = 19) Upper Level (n = 5) Composites: 500hPa Analysis East Coast (n = 5) Central Plains (n = 5) YQB
Low Level (n = 14) Mid Level (n = 19) Upper Level (n = 5) Composites: MSLP,1000-500hPa thickness East Coast (n = 5) Central Plains (n = 5) YQB
Low Level (n = 14) Mid Level (n = 19) Upper Level (n = 5) Composites: 850hPa winds East Coast (n = 5) Central Plains (n = 5) YQB
Low Level (n = 14) Mid Level (n = 19) Upper Level (n = 5) Composites: Precipitable Water (and inset of 850hPa winds) East Coast (n = 5) Central Plains (n = 5) YQB
Low Level (n = 14) Mid Level (n = 19) Upper Level (n = 5) Composites: 850hPa Temperature (and inset of 850hPa winds) East Coast (n = 5) Central Plains (n = 5) YQB
Category Duration Comparisons • Threshold determination (Cheng et al. (2004)) Category (hrs:) max min median mean % ≥ 8hr % ≥ 12hrs Low Level 26 6 7.5 9 50 14 Mid Level 15 6 8 9 58 16 Upper Level 10 7 7 8 40 0 East Coast 23 7 13 15 80 80 Central Plains 15 7 10 11 80 40 • “Processes occurring on the cold side of moving and stationary warm fronts and deep within East Coast air masses were most efficient at producing freezing precipitation per unit area.”. Rauber et al. (2001)
Conclusion • 48 severe events • Partitioned into 5 categories based on a dynamic, time-integrated approach using air parcel trajectories. • Lower tropospheric dynamics: • Ascent and deformation zones • Intensity & duration: connected to spatial distribution of atmospheric patterns • East Coast category associated with events of longest duration • Better insight for meteorologists
Future Work • Continuing research in FZRA: 850hPa analysis of LLJ • Connection between YUL and YQB • Longer duration of FZRA in correlated events. • Maintenance of cold air and the implications of wind channeling and the SLR and Champlain Valleys Purple: Correlated Events Green: Non-correlated Events Blue: Severe Events (YUL) Red: Non-Severe Events (YUL)
Acknowledgements • NSERC • Ouranos • NCDC : for access to the NARR and NCEP Global Reanalysis • NOAA ARL (Hysplit) • Environment Canada