Download
1 / 8
80 likes | 176 Views
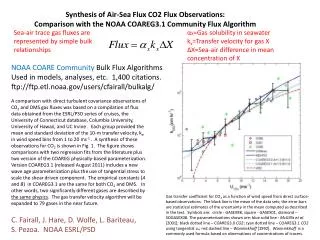
Flux tubes in solar wind from Ulysses observations. G. Li. IGPP, UCR and SSL, Berkeley. References: IGPP conference proceedings 2007, published ApJ letter, submitted. Borovsky, SHINE 2006. Distribution of g( ) = [ b (t) b (t+128sec)]. This analysis.

E N D
Flux tubes in solar wind from Ulysses observations G. Li IGPP, UCR and SSL, Berkeley References: IGPP conference proceedings 2007, published ApJ letter, submitted
This analysis Define f(, ) = distribution of [ b(t) b(t+) ] F(, ) = f(>, ) Study the dependence of F(, ) unambiguously proves the existence of flux tubes. More, the technique can be used to identify individual flux tubes.
Polar region(+): > 30º Equatorial: -30º < <30º Polar region(-) : < -30º Solar maximum: 1999.1 – 2002. 12 Transition period: 98, 03 Solar minimum: 04.1– present 94.1–97. 12, Period classification http://Ulysses.jpl.nasa.gov
Period selection Solar maximum 231 33 113 300 Transition period < -30º >30º -30º < <30º Solar minimum: 93 97 94 95 96 98 99 303 106 185 3 14 < -30º -30º < <30º < -30º >30º 00 04 06 01 02 03 05 07 Solar maximum high latitude (-): 00.1, 00.12, 01.1 Solar maximum high latitude (+):01.10, 02.1, 02.12 Solar maximum low latitude:01.5, 01.6 In transition period the latitude changes quickly, a mixture of a fast and slow solar wind. Solar minimum high latitude(-): 06.4, 06.12 Solar minimum high latitude(+): 96.6, 96.7 Solar minimum low latitude: 97.6, 04.6,05
Identifying individual flux tubes a flux tube boundary a false signal