Download
1 / 18
190 likes | 527 Views
NAVIGATION TRAINING Section 3 Charts . Table of Contents . • Section 1 Types of Navigation • Section 2 Terrestial Coordinates • Section 3 Charts • Section 4 Compass • Section 5 Nautical Publications • Section 6 Navigational Aids • Section 7 Buoyage

E N D
Table of Contents • • Section 1 Types of Navigation • • Section 2 Terrestial Coordinates • • Section 3 Charts • • Section 4 Compass • • Section 5 Nautical Publications • • Section 6 Navigational Aids • • Section 7 Buoyage • • Section 8 Position Lines and Fixes • • Section 9 Tides • • Section 10 Currents • • Section 11 Weather
Charts Mercator Projection All coastal charts of Vancouver Island, northern coasts of BC, Georgia Strait and ports are Mercator Charts.
Charts Mercator Projection ADVANTAGES •Position, distance, and direction can be accurately measured •True shape of features is maintained over small areas
Charts Chart Scale •The relationship between two measurements. Expressed as a ratio. •The scale to which a chart is drawn appears directly under its title.
Charts • Chart Scale • • Large scale chart covers a small area and are used for piloting and inshore navigation. • Small scale charts are less detailed than large scale charts and cover a large area.
Charts Chart Production •The Canadian Hydrographic Service is responsible for all Canadian Charts and Publications. •See www.charts.gc.ca
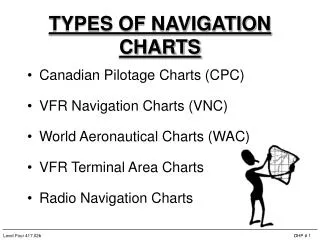
Charts Types of Charts •Coastal charts: Large Scale Charts –1:50,000 - 1:150,000 For approaching bays and harbours, and used for coastal navigation showing outlying reefs and shoals.
Charts Plotting a Position 1. Determine the parallels on the chart that bracket the latitude. 2. Place the pivot point of the compass on the closest line.
Charts Plotting a Position 3. Spread the compass until the lead rests on the given latitude. 4. Move to the approximate longitude and swing an arc.
Charts Plotting a Position 5. The same process is repeated using the longitude scale and the given longitude. 6. The desired position is the intersection of these two arcs.
Charts Plotting a Position 7. If plotted correctly, the intersection should occur at the crest of both arcs.
Charts Measuring Distance •The latitude scale can be used to measure distances, since one degree of latitude equals 60 nautical miles, everywhere on the earth.
Charts Measuring Direction • All rhumb lines on a Mercator projection represent true directions. • Measurement of direction on a Mercator chart is accomplished by using a parallel ruler to transfer the direction of a rhumb line to a nearby compass rose.
Charts Measuring Direction 045˚ True 060˚ Magnetic
Charts Correction of Charts •The Canadian Hydrographer issues weekly Notices to Mariners, which include corrections to be made to Canadian charts. • When charts are bought, they are generally corrected up to date. • Once in use Notices to Mariners should be checked and corrections to charts made as necessary.
Charts Correction of Charts • When a correction has been made, a note of the year and Notice to Mariner number should be made in the bottom left hand corner of the chart, having checked that the previous correction has been made. 2008- 41- 74 - 86 - 127