Download
1 / 25
250 likes | 492 Views
An Introduction to Social Network Analysis. Fulvio D’Antonio NARG: Network Analysis Research Group DII - Dipartimento di Ingegneria dell'Informazione Università Politecnica delle Marche. Outline. What is a social network? A little history…

E N D
An Introduction to Social Network Analysis Fulvio D’Antonio NARG: Network AnalysisResearch Group DII - Dipartimento di Ingegneria dell'Informazione Università Politecnica delle Marche
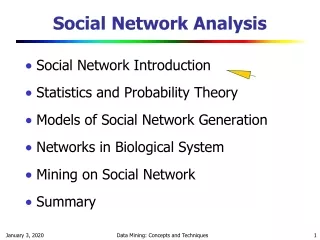
Outline • Whatis a social network? • A littlehistory… • Modelling social networkswithrandomgraphs • Link prediction • Content-based social networks
Whatis a Social Network? • Networks in whichnodes and tiesmodelsocial phenomena. • Generallyrepresentedusinggraphs • Differentkindofrelationships: • Static (kinship, friendship, similarity,…) • Dynamic(information flow, material flow,…)
History • In the 19th century Durkheim introduces the concept of “social facts” • phenomena that are created by the interactions of individuals, yet constitute a reality that is independent of any individual actor. • In the 1930s, Moreno: • the systematic recording and analysis of social interaction in small groups, especially classrooms and work groups (sociometry) • He invents the “sociogram” (graphical representation of interpersonal relationships)
History (2):Milgram’sexperiment (1960s) • People in Nebraska, were each given a letter addressed to a target person in Boston, Massachusetts, along with demographic information (name, address, profession) on this person. • They were asked to send the letter to the target person, by forwarding it to other people • Average number of hops to get the letter to the target: 6 • “six degrees of separation”
History (3):The Strength of Weak Ties • Granovetter • “The Strength of Weak Ties” (1973) • considered one of the most important sociology papers written in recent decades • He argued that “weak ties” could actually be more advantageous in politics or in seeking employment than “strong ties” • Some reasons: • They allows you to reach a vaster audience. • Information coming from weak ties is “fresh”
Understanding Networks with Random Graphs • A random graph is a graph that is generated by some random process • The objective is to study the properties of random graphs (e.g. diameter, clustering coefficient, mean degree) • Are generated graphs compatible with actual social networks? • Differentapproaches: • Erdős–Rényi Graphs • Small-World model • Barabasi-albert model
Random Graphs • Studied by P. Erdös A. Rényi in 1960s • How to build a random graph • Take n vertices • Connect each pair of vertices with an edge with some probability p • There are n(n-1)/2possible edges • The mean number of edges per vertex is
Degree Distribution • Probability that a vertex of has degree k follows binomial distribution • In the limit of n >> kz, Poisson distribution • z is the mean
Characteristics • Small-world effect (Milgram 60s) • Diameter (Bollobas) • Average vertex-vertex distance • Grows slowly (logarithmically with the size) • Doesn’t fitreal-world networks • Degree distribution (not Poisson!) • Clustering (Network transitivity) • Random graphs: small clustering coefficient • social networks, biological networks in nature,artificial networks – power grid, WWW: significantlyhigher
Clustering • If A is connected to B, and B is connected to C, then it is likely that A is connected to C • “A friend of your friend is your friend” • The average fraction of a node’s neighbor pairs that are also neighbors each other
Small-World Model • Watts-Strogatz (1998) first introduced small world model • Mixture of regular and random networks • Regular Graphs have a high clustering coefficient, but also a high diameter • Random Graphs have a low clustering coefficient, but a low diameter • Characteristic of the small-world model • The length of the shortest chain connecting two vertices grow very slowly, i.e., in general logarithmically, with the size of the network • Higher clustering or network transitivity
Small-World Model (2) • Construct a regular ring lattice . Each node has degree k • For every node take every edge (a,b) with i < j, and rewire it with probability β
Scale-Free Network • A small proportion of the nodes in a scale-free network have high degree of connection • Power law distribution • A given node has k connections to other nodes with probability as the power law distribution with exponent ~ [2, 3] • Examples of known scale-free networks: • Communication Network - Internet • Ecosystems and Cellular Systems • Social network responsible for spread of disease
Barabasi-Albert Networks • Start from a small number of node, add a new node with m links • Preferential Attachment • Probability of these links to connect to existing nodes is proportional to the node’s degree • “The rich gets richer” • This creates ‘hubs’: few nodes with very large degrees
Link Prediction • Who will be connected in the next future (present or past)? • Why link prediction? • Eliciting hidden or Incomplete link information • Missing links from data collection (criminal networks) • Recommendation • Friends, groups in social networks • Product, Book, Movie, Music on e-commerce site • Articles on content site • Who should one collaborate? • ….
Ok, this was about the structure…. but what about the content?
Content-based social networks • A special kind of Social Networks • The actors (nodes) of the network produce documents • They can be produced by more than one actor • co-authorship relationship • Similarityrelationship between any 2 actors A and B of the network can be estimated using a function on the set of documents produced Doc(A) and Doc(B) • Sim: DOC(A) DOC(B) [0,1]
Automaticallydetectingcontent-based social networks NLP Methodology*: • Choose a set of actors and gather related documents; • Pre-process textual data to extract raw text; • Process raw text with a part-of-speech tagger; • Extract candidate annotating terms by using a set of part-of-speech patterns • Rank candidates, possibly filter them choosing a threshold; • Output a set of weighted vectors V of annotating terms for each documents; • Group the vectors by actor and construct a centroid (i.e. a mean vector) with such groups. This centroid roughly represents the actor main interests. • Build a graph by computing a similarity function for each pair of centroids. *Cooperation with university of Rome
Reducing Information Dimensionality:Clustering / Community finding • dividing a set of data-points into subsets (called clusters) so that points in the same cluster are similar in some sense • Crisp/Fuzzy clustering • Partitive/Non partitive clustering • K-means, repeated bisection, graph partitioning,… • Cohesive subgroups detection: • Cliques • K-Cliques • K-Plex • Density based subgraphs
Experiments: ResearchNetworks • INTEROP NoE (6FP): • Domain Ontology expressed using OWL (Ontology Web Language) in the Interoperability of Software Application domain • INTEROP partners’ corpus • 2 types of edges: • Coauthorship • Similarity
Evaluation: predictive power of the model • We evaluated how many of the possible opportunities computed for year 2003 have been exploited in the rest of the project (2004-2007). • Perc. of opportunities for year 2003 realized in the rest of the project (2004-2007) • Perc. of opportunities for year 2004 realized in the rest of the project (2005-2007)
Experiments: PatentNetworks • The European Patent Office (EPO): • web-services to access to information about European patents that have been registered; • the date of presentation • the applicant name and mission, • the address of the applicant • textual description of the patent.