Download
1 / 29
290 likes | 444 Views
Statistics. Context Data Variation. 5 number summary. Max Min Median Q1 Q3 Range Mean Mode IQR Sum n. Write up . Write the data in sentences Write the explanation in paragraph format Context, use it before or after the explanation. CUSS- Center, Unusual, shape, spread.

E N D
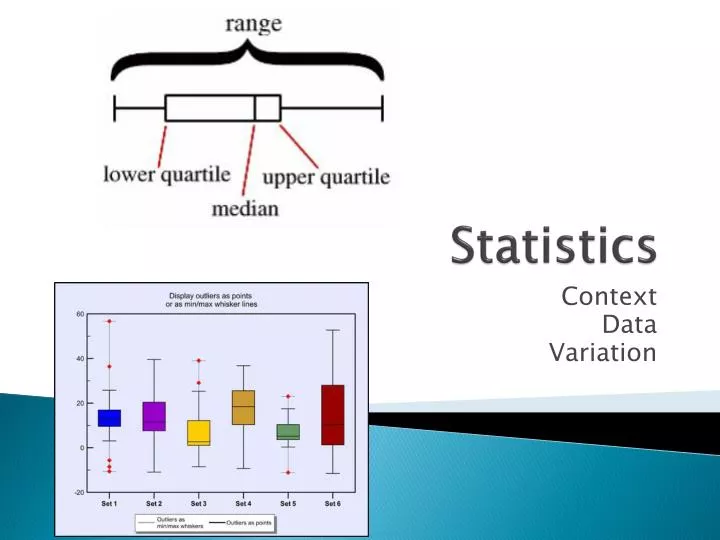
Statistics Context Data Variation
5 number summary • Max • Min • Median • Q1 • Q3 • Range • Mean • Mode • IQR • Sum • n
Write up • Write the data in sentences • Write the explanation in paragraph format • Context, use it before or after the explanation. • CUSS- Center, Unusual, shape, spread.
Find the mean, median, and mode of the following collection. • 15, 11, 19, 15, 14, 13, 17, 11, 12, 17, 15, 14, 15
1. Find the mean, median, mode, and range of the following collection of scores on a test. • 32, 72, 81, 95, 98, 58, 77, 75, 83, 97, 45, 89, 93, 57, 82, 97, 52, 75, 79, 78, 99, 98, 54, 75, 85, 61, 55, 86
Find the first, second, and third quartiles of the collection of data in Exercise 1. • 32, 72, 81, 95, 98, 58, 77, 75, 83, 97, 45, 89, 93, 57, 82, 97, 52, 75, 79, 78, 99, 98, 54, 75, 85, 61, 55, 86
With a partner • Complete #1-3 for the following set of data. The weights (in pounds) of eleven children are as follows: 39, 52, 40, 45, 46, 55, 48, 40, 43, 47, 44
Organizing Data • At a car dealership, the number of new cars sold in a week by each salesperson was as follows: 5, 8, 2, 0, 2, 4, 7, 4, 1, 1, 2, 2, 0, 1, 2, 0, 1, 3, 3, 2
a. Construct a frequency distribution for this data. • 5, 8, 2, 0, 2, 4, 7, 4, 1, 1, 2, 2, 0, 1, 2, 0, 1, 3, 3, 2 • Number, Tally, Frequency
Construct a line plot for this data • 5, 8, 2, 0, 2, 4, 7, 4, 1, 1, 2, 2, 0, 1, 2, 0, 1, 3, 3, 2
Construct a bar graph that shows the number of salespeople who sold 0-8 cars. • 5, 8, 2, 0, 2, 4, 7, 4, 1, 1, 2, 2, 0, 1, 2, 0, 1, 3, 3, 2
Construct a frequency distribution and a line plot for this data. • Twenty-eight students in a class were asked how many cars their family owned. The results were as follows: • 2, 2, 3, 2, 1, 2, 2, 4, 3, 2, 0, 1, 0, 1, 1, 2, 2, 3, 2, 3, 3, 5, 1, 1, 3, 0, 1, 2
Construct a bar graph that shows these results • Each of the members of a recent high school graduating class was asked to name his/her favorite among these subjects: English, foreign language, history, mathematics, science. The results are shown in the table • English 62 • Foreign Language 40 • History 40 • Mathematics 18 • Science 33
Construct a stem-and-leaf plot for the unordered data • 63, 52, 84, 83, 51, 32, 58, 35, 45, 41, 65, 75, 59, 67, 25, 46 • A stem-and-leaf plot orders data in increasing or decreasing order.
Histograms • 1.Construct and label a horizontal number line that is scaled to contain all of the values of the variable of interest.2. Construct and label a vertical axis so that the greatest frequency can be represented. • 3. Construct the bars of equal width that are centered above each value. The heights of the bars represent the frequencies of the values.
Construct a stem-and-leaf plot for the data • 15, 59, 66, 42, 48, 23, 70, 81, 35, 51, 68, 29, 77, 92, 85, 16, 37, 59, 61, 76, 40, 25, 86, 11, 34, 52, 16, 22, 89, 55, 47, 39, 27, 42, 46, 51, 24, 69, 78, 91, 90, 65
Construct a histogram for the above data. • 15, 59, 66, 42, 48, 23, 70, 81, 35, 51, 68, 29, 77, 92, 85, 16, 37, 59, 61, 76, 40, 25, 86, 11, 34, 52, 16, 22, 89, 55, 47, 39, 27, 42, 46, 51, 24, 69, 78, 91, 90, 65
Box plot and stem and leaf plot • Graph a box plot for the following test scores: {90, 80, 96, 54, 80, 95, 100, 75, 87, 62, 65, 85, 92, 87, 74, 89} • Draw a stem and leaf plot for the data
Write up with Context • Explain the shape in the context of the problem! For example, consider a distribution of grades which is skewed to the right and has a median score of 70. Do not write "The distribution is skewed to the right." Instead write "Many students had scores close to 70, but a few students scored much higher."
The box in a boxplot represents the interquartile range and gives the interval which contains 50% of the observations. 25% of the observations are less than the first quartile, and 25% of the observations are greater than the third quartile.
at a school field day, 50 students and 50 faculty members each completed an obstacle course. Descriptive statistics for the completion times (in minutes) for the two groups are shown below:
Task • Use the same scale to draw boxplots for the completion times for students and for faculty members. • (b) Write a few sentences comparing the variability of the two distributions. • (c) You have been asked to report on this event for the school newspaper. Write a few sentences describing student and faculty performances in this competition for the paper.
TASK • Five hundred randomly selected middle-aged men and five hundred randomly selected young adult men were rated on a scale from 1 to lO on their physical flexibility, with 10 being the most flexible. Their ratings appear in the frequency table below. For example, 17 middle-aged men had a flexibility rating of 1
Display these data graphically so that the flexibility of middle-aged men and young adult men can be easily compared. • Based on an examination of your graphical display, write a few sentences comparing the flexibility of middle-aged men with the flexibility of young adult men