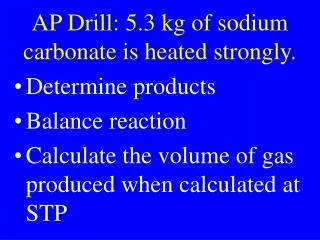
Download
1 / 22
230 likes | 499 Views
Example 5.2: Anhydrous Sodium carbonate Structure with strong harmonic modulation of positions and ADP. Chemical formula: Na 2 CO 3 3d incommensurate commensurate. Alpha 9.02, 5.21, 6.50 90, 90, 90 P6 3 /mmm. Beta 8.98, 5.25, 6.21 90, 90.33, 90 C2/m.

E N D
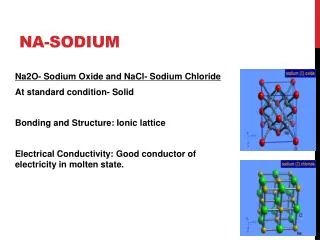
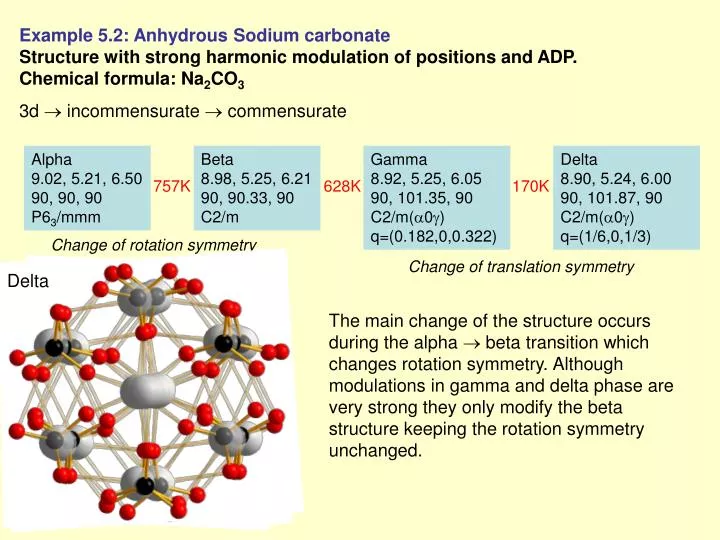
Example 5.2: Anhydrous Sodium carbonate Structure with strong harmonic modulation of positions and ADP. Chemical formula: Na2CO3 3d incommensurate commensurate Alpha9.02, 5.21, 6.5090, 90, 90P63/mmm Beta8.98, 5.25, 6.2190, 90.33, 90C2/m Gamma8.92, 5.25, 6.0590, 101.35, 90C2/m(0)q=(0.182,0,0.322) Delta8.90, 5.24, 6.0090, 101.87, 90C2/m(0)q=(1/6,0,1/3) 757K 628K 170K Change of rotation symmetry Change of translation symmetry Alpha Beta Delta Gamma The main change of the structure occurs during the alpha beta transition which changes rotation symmetry. Although modulations in gamma and delta phase are very strong they only modify the beta structure keeping the rotation symmetry unchanged.
Data for the phase gamma Single crystal data measured with KUMA four-circle diffractometer Input files: naco.hkl, naco.cif_od Frame scaling, absorption correction: done with software of diffractometer Unit cell: a=8.9338, b=5.2678, c=6.0565, α=90.1018. β=101.551, γ=89.7404 q vector: (0.1776, 0, 0.3252) c* a*
Import wizard 1 2 3
Symmetry wizard 1 2
3 Data processing was done with C centering.
Space group from main reflections 4 5 Superspace group from satellite reflections • Symbol C2/m(0b0)s0 means: • 3d symmetry C2/c • q vector (0 β 0) • shift by ½ in x4 • M50:symmetry x1 x2 x3 x4 • symmetry -x1 x2 -x3 -x4+1/2 • symmetry -x1 -x2 -x3 -x4 • symmetry x1 -x2 x3 x4+1/2 6
Structure solution wizard The only reason for the random seed is compatibility with the text of Jana Cookbook. Convergence with R~21%
The plot helps to identify oxygens C1 and C2 will be changed to oxygens with “Edit atoms” tool of Jana
Structure refinement Refinement of the initial structure model Adding position modulation waves
Refinement with harmonic ADP and four position modulation waves for all atoms
Coordinates of Na1: x,y,z Sections to plot: x2-x4 Range of x2: from (y – 2Å/b) to (y + 2Å/b) step 0.02Å Range of x4: from 0 to 2, step 0.02 Stacking of sections: x2-x4 x3(1) x1(1) x2-x4 x3(2) x1(1) …. x2-x4 x3(n) x1(1) x2-x4 x3(1) x1(2) x2-x4 x3(2) x1(2) …. x2-x4 x3(n) x1(m) Range of x1: from (x-1Å/a) to (x+1Å/a) step 0.02Å Range of x3: from (z-1Å/c) to (z+1Å/c) step 0.02Å Fourier maps and Contour plots
Observed and difference Fourier map for Na1 indicates modulation of ADP Similar features can be seen in difference maps of other atoms except carbon
Adding ADP modulation waves Final refinement
Final difference maps Contour step 0.1
Interpretation of structure model using Grapht Internal coordinate t t=0 t=1