Download
1 / 25
250 likes | 472 Views
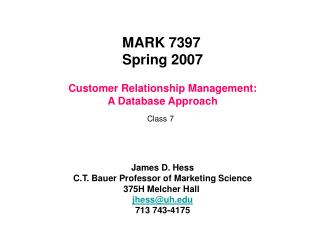
MARK 7397 Spring 2007. Customer Relationship Management: A Database Approach. Class 2. James D. Hess C.T. Bauer Professor of Marketing Science 375H Melcher Hall jhess@uh.edu 713 743-4175. Marketing Metrics. Traditional. Primary Customer-based. Popular Customer-based. Strategic

E N D
MARK 7397 Spring 2007 Customer Relationship Management:A Database Approach Class 2 James D. Hess C.T. Bauer Professor of Marketing Science 375H Melcher Hall jhess@uh.edu 713 743-4175
Marketing Metrics Traditional Primary Customer-based Popular Customer-based Strategic Customer-based Market Share Sales Growth Customer Acquisition Customer Activity Marketing Metrics
Primary Customer Based Metrics • Customer Acquisition Measurements • Acquisition rate • Acquisition cost • Customer Activity Measurements • Average interpurchase time (AIT) • Retention rate • Defection rate • Survival rate • P (Active) • Lifetime Duration • Win-back rate
Acquisition Rate • Acquisition defined as first purchase or purchasing in the first predefined period • Acquisition rate (%) = 100*Number of prospects acquired / Number of prospects targeted • Denotes average probability of acquiring a customer from a population • Always calculated for a group of customers • Typically computed on a campaign-by-campaign basis Information source Numerator: From internal records Denominator: Prospect database and/or market research data Evaluation Important metric, but cannot be considered in isolation
Acquisition Cost • Measured in monetary terms • Acquisition cost ($) = Acquisition spending ($) / Number of prospects acquired • Precise values for companies targeting prospects through direct mail • Less precise for broadcasted communication Information source: • Numerator: from internal records • Denominator: from internal records Evaluation: • Difficult to monitor on a customer by customer basis
Average Inter-purchase Time (AIT) • Average Inter-purchase Time of a customer = 1 / Number of purchase incidences from the first purchase till the current time period • Measured in time periods • Information from sales records • Important for industries where customers buy on a frequent basis Information source Sales records Evaluation: Easy to calculate, useful for industries where customers make frequent purchases Firm intervention might be warranted anytime customers fall considerably below their AIT
Retention and Defection • Retention rate (%) = 100* Number of customers in cohort buying in (t)| buying in (t-1) / Number of customers in cohort buying in (t-1) • Avg. retention rate (%) = [1 – (1/Avg. lifetime duration)] • Avg. Defection rate (%) = 1 – Avg. Retention rate Plotting entire series of customers that defect each period, shows variation (or heterogeneity) around the average lifetime duration of 4 years.
Customer Lifetime Duration when the Information is Incomplete Buyer 1 Buyer 2 Buyer 3 Buyer 4 Observation window Buyer 1: complete information Buyer 2 : left-censored Buyer 3: right-censored Buyer 4: left-and-right-censored
Life Table with only right censoring Buyer 1 Buyer 2 Buyer 3 Buyer 4 t Buyer 1: Withdrew late (still active when last observed) Buyer 2 : Withdrew early (still active when last observed) Buyer 3: Terminated late (did not survive past observed date) Buyer 4: Terminated early (did not survive past observed date)
Basic Survival Math S(t) = probability that customer will “survive” until at least time t = 1-F(t) where F(t) is the traditional “cumulative distribution” f(t) = probability that survival ends at t = -S’(t)=F’(t) 1.0 S(t) f(t) t 0 S(t0+t) ---------- = Conditional Survival = probability that customer lasts until at least t0+t given that they lasted until t0 S(t0)
1 h(t) h0 S(t)=exp(-h0t) t Hazard Rate and Related Stuff f(t) h(t)= -------- = Hazard Rate= prob that survival ends at t given that customer makes it to t S(t) H(t)=cumulative hazard rate = -ln[S(t)] S(t)=exp[-H(t)] Constant Hazard Rate Model h(t)=h0, a constant in time H(t)=h0 t S(t)=exp(-h0 t) f(t)=h0exp(-h0 t) E[t]= 1/h0 E[t0+t | customer made it to t0] = t0 +1/h0
Proportional Hazard Rate Model What if the event varies with customer/situational factors X? h(t) = hB(t) exp(bX), where hB(t) is the baseline hazard rate.* The baseline hazard rate hB(t) is metaphorically like an “intercept” because when X=0, then exp(bX)=1.0 h(t) = hB(t). If bX > 0, then exp(bX)>1.0, so hazard rates increase above baseline. If bX < 0, then exp(bX)<1.0, so hazard rates decrease below baseline. The coefficients b are chosen in a regression-like fashion, accounting for customer factors and censored data. In SPSS this is done in Survival/Cox Regression. *Why not have hB(t) bX? Hazard rates must be positive!
Proportional Hazards Assuming Constant Baseline Hazard h(t|Age) = hB(t) exp(bX) = 0.108 exp(-0.065 Age) E[t0+t | customer of Age made it to t0] = t0 + exp(-bX)/h0 = t0 + exp(0.065 Age)/0.108 E[ t | Age made it to t0] =exp(-bX)/h0 =exp(0.065 Age)/0.108
Summary • In the absence of individual customer data, companies used to rely on traditional marketing metrics like market share and sales growth • Acquisition measurement metrics measure the customer level success of marketing efforts to acquire new customers • Customer activity metrics track customer activities after the acquisition stage • Lifetime duration is a very important metric in the calculation of the customer lifetime value and is different in contractual and non-contractual situations