Download

1 / 71
720 likes | 751 Views
Learn about unit hydrographs, their theory, data analysis, and synthesis methods. Understand the concept, modeling, and practical applications in hydrology engineering. Explore parametric unit hydrographs for efficient analysis and prediction. Enhance your skills with real-world examples and tools like HEC-HMS.

E N D
CE 3354 Engineering Hydrology Lecture 14: Unit Hydrographs
Outline • Unit Hydrographs • Theory • Data Analysis to construct a UH • Chapter 7 CMM
Unit hydrographs • What is a unit hydrograph? • How are they used? • How are they built from data (analysis)? • How are they built when data do not exist (synthesis)?
What is a Unit hydrograph? • Used to explain the time re-distribution of excess precipitation on a watershed • Represents the response of the watershed at the outlet to a unit depth of EXCESS precipitation • EXCESS implies some kind of loss model is applied to the raw precipitation • Time re-distribution implies some kind of transfer behavior is applied • L. K. Sherman 1932 is credited with seminal publication of the concept • Read the document in AdditionalReadings
Response MODEL • Watershed • Losses • Transformation • Storage • Routing
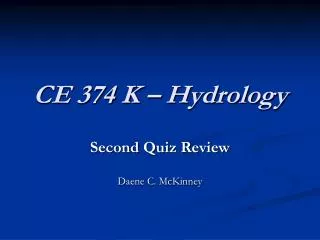
Response model • Response models convert the excess precipitation signal into a direct runoff hydrograph at the point of interest Precipitation Losses Loss Model Excess Precipitation Response (Transform) Runoff
D Response models Precipitation Precipitation Loss Excess Tlag Excess Runoff TP Loss TD Time
Hyetographs • Typically divided into three components • Initial abstraction • Loss • Excess • This component becomes direct runoff
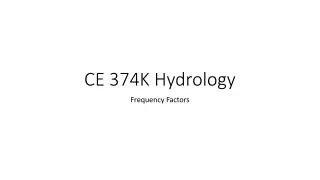
Unit hydrograph - example • The example is from CMM pp 216-223 • Least-Squares Approach Depth Flow Time
Unit hydrograph - example • Build an equation array using the unknown unit weights and the known EXCESS precipitation depths, and the known discharge values
Unit hydrographs -- example • Observe that if the linear system has full ranked matrix (rows=columns) and non-zero diagonal, one could just solve the resulting linear equation for the unitgraph weights • Probably better than manual back-substitution which is error prone • Many instances the system is over-determined – more equations than unknowns and an optimization technique is usually applied
Using unit hydrographs • The whole point is to use the unitgraph to predict the response to a different storm (either real or a design storm)
Parametric unit hydrographs • Parametric UH are simply functions with parameters (like F=ma) where if we have the parameters the hydrograph can be reconstructed using the function rather than keeping around a bunch of unit response values • Will illustrate using same example
Parametric unit hydrographs • Parametric UH are simply functions with parameters (like F=ma) where if we have the parameters the hydrograph can be reconstructed using the function rather than keeping around a bunch of unit response values • Will illustrate using same example
Value of parametric unit hydrographs • Fewer values to keep track of • Simple extension of time-base • If the parameters can be associated with watershed metrics (Slope, MCL, soil properties, shape, etc.) the resulting model is called a synthetic unit hydrograph • Called synthetic because response can be synthesized from the metrics rather than from analyzing observations (which we may not have in cases of practical interest)
Hydrographs • FHWA-NHI-02-001 Highway Hydrology • Chapter 6, Section 6.1 • Systems Approach • Input : Hyetograph • Transfer : Unit Hydrograph • Output : Total Runoff Hydrograph
Hydrographs • Hydrograph Analysis • Measured rainfall and runoff to infer the transfer function. • Implies: Have DATA. • Hydrograph Synthesis • Physical properties of watershed used to postulate the transfer function. • Actual measurements not required – Produces an ESTIMATE Module 7
Parametric Unit Hydrographs • HEC-HMS has several different UH models available (eg. NRCS DUH, Clark, etc.). • These models are described by “parameters” • NRCS (Tp or Tc) • Clark (Tc, R) • Selection of the parameters selects the shape of the UH and the time base (or time to peak). • The analyst can also enter an empirical (user specified) unit hydrograph.
Developing Unit Hydrographs (Analysis) • Follow FHWA methods • Essentially back-substitution or OLS • Use HEC-HMS and parametric UH, adjust values of parameters to fit observed runoff • Less tedious • Use HEC-HMS and user supplied UH, adjust values of UH ordinates (and re-scale to maintain a unit response) to fit observed runoff • Less tedious
Parametric Unit Hydrographs in HMS • Present an example that uses • NRCS DUH • Clark Unit Hydrograph • Useful parametric models are listed below along with their parameters. • NRCS DUH : Tlag (Timing only) • Clark : Tc, and R (Timing and a storage-delay) • Snyder : Tlag, Cp (Timing and a peak rate factor) • Gamma : (User-Specified) Tc, K (Timing and a shape factor)
Synthesizing Unit Hydrographs • Synthesis does not use rainfall-runoff data. • Uses measurements on the watershed to postulate parameters of a parametric unit hydrograph.
Example HEC-HMS Simulation Developing a Unit Hydrograph
Purpose • Illustrate using HEC-HMS to develop a unit-hydrograph • Parametric UHs • User-specified UHs
Learning Objectives • Learn how to use HMS to construct a parametric Unit Hydrograph • Use trial-and-error to select parameters that fit observations. • Learn how to supply an arbitrary user-specified Unit Hydrograph to HMS
Problem Statement • Determine the UH parameters for the precipitation and direct runoff for the watershed of Example 6.2 in FHWA “Highway Hydrology” • Use FHWA rainfall and direct runoff values as input and runoff.
Background and Data • Watershed Properties • AREA = 0.39mi2 • SLOPE = Unknown • CN = Unknown • Precipitation = Given • Direct Runoff = Given
Background and Data • Precipitation
Background and Data • Direct Runoff • Baseflow already separated
Approach • Actually reasonably straight-forward in HEC-HMS • Create a single sub-basin watershed. • Import the rainfall and direct runoff. • Adjust loss and UH models to fit observations. • Interpret and report results.
Approach – control specifications • Catch the missing warnings, fix, and run
Approach – first run • First simulation – volumes mismatch, need a loss model
Approach – pick a loss model • Ia = 0.06 in, Cl =0.0
Approach • Second run, still volume mismatch. Increase the Cl value.