Download
1 / 24
240 likes | 368 Views
RAVE : Resource-Aware Visualization Environment Dr. Ian J. Grimstead Prof. Nick J. Avis Prof. David W. Walker Cardiff School of Computer Science Cardiff, Wales, UK. Presentation Structure. Data Visualization: Pros and Cons A Solution: The RAVE project Demonstration of RAVE

E N D
RAVE:Resource-AwareVisualization EnvironmentDr. Ian J. GrimsteadProf. Nick J. Avis Prof. David W. WalkerCardiff School of Computer ScienceCardiff, Wales, UK
Presentation Structure • Data Visualization: Pros and Cons • A Solution: The RAVE project • Demonstration of RAVE • How RAVE works • Latest results • Conclusion
...or too little Too much info... Data Visualization:Simulations • Test theories without physically building • Cheaper to construct new tests • Can run overnight without human intervention • Simulations produce lots of information • But - hard to understand...
Image courtesy of IBM Research Generated with IBM Open Visualization Data Explorer Data Visualization:Comprehension • Solution–graphical visualization of data • View a model of the data, not the data • Massachusetts Bay • Colours, contours,... • Easier to comprehend • Data is now interactive
Data Visualization:Machine Dependence • System is often single platform • Microsoft vs. UNIX vs. Apple Mac vs. ... • Handheld vs. workstation vs. ... • Need to buy more copies of the system!
Data Visualization:Multiple Users • Hard to collaborate with other users • Usually – must all crowd around one machine • Unless a large display is available • One person “driving” – others are passive • System is not assisting with collaboration
Data Visualization:Specialist Equipment • May require specialist computer • Capable of displaying complex data • Prohibitively expensive to own • User may need to move to machine • Problem if only one machine • Overloaded – too slow to be usable • All displays are in use • What if it breaks?
Data Visualization:Summary • Pros: • Can comprehend much more information • Data is now interactive • Cons: • Restricted to specific machine/platform • May require specialist computer • Hard for users to collaborate
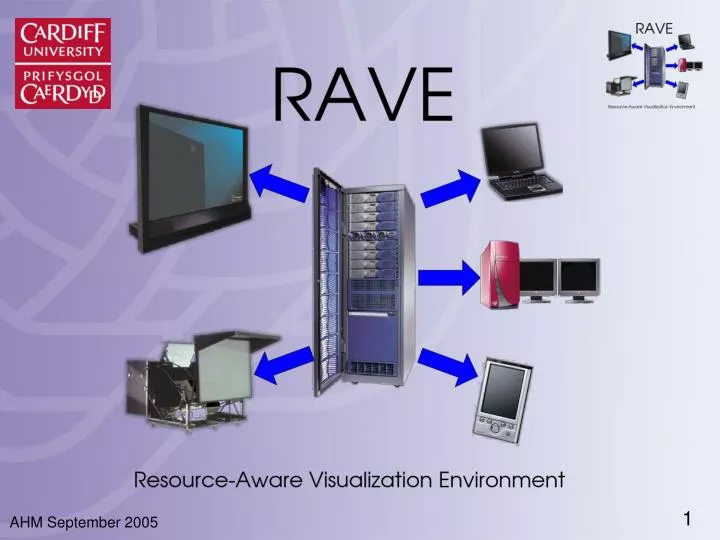
A Solution:The RAVE Project • RAVE supports: • Various types of machine/display • Immersadesk → workstation → PDA • Multiple machines/resources • Resource-aware: network, machine load • Multiple users • Resource sharing • Collaboration • RAVE is now demonstrated...
Demonstration • Recorded demo • Resources: • Windows laptop (active clients, Java) • Remote Linux/Solaris/IRIX servers • Data servers • Uses: • WeSC UDDI server • WeSC Service-Orientated Grid
The RAVE Project:How it Works • Each RAVE component now examined: • Data Distribution - Data Server • Displaying the Data - Active Client • Lightweight clients - Render Server, Thin Client • Service Discovery • Tiled rendering with Active Client • Remote (dynamic) data feed
Internet or remote machine RAVE Client RAVE Client RAVE Client Visualization Data Data to be visualised Data Server Data Distribution • First component: Data Server • Acts as a distribution point & interpreter • Understands many types of data • Uses Java3D+Xj3D as importer
Visual drawn on local machine Visualization Data Data Server Isosurface of MRI from Large Geometric Models Archive (~850kpoly, 3 nodes, 19.8Mb raw data) Bootstrap DS→AC: 12.4s Note: Windows XP Diffusion Tensor Imaging, SHEFC Brain Imaging Research Centre for Scotland, Martin Connell and Mark Bastin (~950kpoly, 2200 nodes, 29.8Mb raw data) Bootstrap DS→AC: 20.9s Geology dataset (10 minute ETOPO from National Geophysical Data Center (~4.6Mpoly, 3 nodes, 109.6Mb raw data) Bootstrap DS→AC: 48.3s Displaying the Data • Second component: Active RAVE Client • “Active” – facilities to draw on its own • Accepts feed from Data Server • Presents images of data to user Active RAVE Client
Lightweight Clients Visual drawn off-screen (hidden) Visual Interaction Visualization Data Render Server Thin Client Data Server MolScript VRML of 1PRC molecule (Research Collaboratory for Structural Bioinformatics – Protein Data Bank) (~546kpoly, 29,000 nodes, 23.2Mb raw data) 96.5s DS→RS (# nodes) 3.2fps @ 400x400 (11Mbit shared wireless) Isosurface of MRI scan Large Geometric Models Archive (~850kpoly, 3 nodes, 3.2fps @ 400x400 11Mbit wireless) • Third component: the Render Server • Drawn visual sent to Thin RAVE Clients • “Thin”-insufficient power/resources to draw data
Service Discovery • Servers are “advertised” on the network • Using standardised methods • UDDI, Grid/Web Services • We can reuse the work of other people • UDDI4J, Apache Axis, Globus • Human user can see list of servers • Select most appropriate one • Consider speed, memory, bandwidth... • May already have your required data on it • Or automatically select with a heuristic
Remote, Dynamic Data • Independent simulation can supply Data Server • Simulation code instrumented • Transmits scene creation to Data Server • Subsequent updates also sent • Data Server reflects updates • Multiple clients can view live simulation
UDDI Server Search for RS Drawn Visual Render Server Render Server Available RS Drawn Visual Tiled Rendering • If your machine can nearly cope: • Request assistance from a Render Service • Automatically select RS with heuristic • Locally render subset (tile) of data • Remainder rendered by Render Server Visualization Data Active Client Data Server
Tiled Rendering:Latest Results Tiling advantage @ 600kv? Perfectly tri-stripped ~29,000 nodes; ~2.2 v:p ~1.3 v:p
Tiled Rendering:Discussion • Is it worth it? • Only in specific circumstances: • When GPU fillrate is local bottleneck • T&L constant between 50% and 100% • Sufficient network bandwidth available • Examples: • Hand dataset – perfectly tristripped • GPU T&L not bottleneck 200% speedup • 1PRC – hardly tristripped (2.2 verts/poly) • GPU T&L bottleneck 20% slowdown
RAVE: Summary • Data Server reads data and distributes • Active Client renders locally • Thin Client renders via Render Server • Active Client may request assistance • All resources shared where possible • Uses Java to support (most) platforms
Conclusion • Visualization – great! • But requires specialist hardware or software • Often not designed for multiple users • Solution - “RAVE” • Utilise any available machines/resources • Collaborative – work from your desk • Further information: • http://www.wesc.ac.uk/projectsite/rave/
Acknowledgements • Project funding: UK DTI & SGI • Diffuse Tensor Imaging dataset: • Martin Connell and Mark Bastin, SHEFC Brain Imaging Research Centre for Scotland • Molecule geometry: • Research Collaboratory for Structural Bioinformatics Protein Data Bank, using MolScript • Skeletal hand: • Large Geometric Models Archive, Georgia Institute of Technology • ETOPO dataset: • National Geophysical Data Center (NGDC)